GLEAM full scRNA-seq workflow
Source:vignettes/GLEAM_full_scrna_workflow.Rmd
GLEAM_full_scrna_workflow.Rmd1) Load Seurat object
library(Seurat)
#> Loading required package: SeuratObject
#> Loading required package: sp
#>
#> Attaching package: 'SeuratObject'
#> The following object is masked from 'package:GLEAM':
#>
#>     pbmc_small
#> The following objects are masked from 'package:base':
#>
#>     intersect, t

ifnb_path <- system.file("extdata", "full_examples", "ifnb_seurat.rds", package = "GLEAM")
src_ifnb_path <- if (!is.null(pkg_root)) file.path(pkg_root, "inst", "extdata", "full_examples", "ifnb_seurat.rds") else ""

if (nzchar(ifnb_path) && file.exists(ifnb_path)) {
  seu <- readRDS(ifnb_path)
} else if (nzchar(src_ifnb_path) && file.exists(src_ifnb_path)) {
  seu <- readRDS(src_ifnb_path)
} else {
  data("pbmc_medium_matrix", package = "GLEAM")
  data("pbmc_medium_meta", package = "GLEAM")

  md <- as.data.frame(pbmc_medium_meta, stringsAsFactors = FALSE)
  if ("cell_id" %in% colnames(md)) rownames(md) <- as.character(md$cell_id)

  cells_avail <- intersect(colnames(pbmc_medium_matrix), rownames(md))
  seu <- Seurat::CreateSeuratObject(
    counts = pbmc_medium_matrix[, cells_avail, drop = FALSE],
    meta.data = md[cells_avail, , drop = FALSE],
    assay = "RNA"
  )

  if (!"orig.ident" %in% colnames(seu@meta.data) && "sample" %in% colnames(seu@meta.data)) {
    seu$orig.ident <- as.character(seu$sample)
  }
  if (!"seurat_annotations" %in% colnames(seu@meta.data) && "celltype" %in% colnames(seu@meta.data)) {
    seu$seurat_annotations <- as.character(seu$celltype)
  }

  if ("condition" %in% colnames(seu@meta.data)) {
    stim <- tolower(as.character(seu$condition))
  } else if ("group" %in% colnames(seu@meta.data)) {
    stim <- tolower(as.character(seu$group))
  } else {
    stim <- rep("ctrl", ncol(seu))
  }
  stim[stim %in% c("control", "ctrl", "unstim", "nonstim", "baseline")] <- "ctrl"
  stim[stim %in% c("treated", "treat", "stimulated", "stim")] <- "stim"
  seu$stim <- stim
}

if (!"orig.ident" %in% colnames(seu@meta.data)) seu$orig.ident <- "sample1"
if (!"seurat_annotations" %in% colnames(seu@meta.data)) seu$seurat_annotations <- "Unknown"
if (!"stim" %in% colnames(seu@meta.data)) seu$stim <- rep("ctrl", ncol(seu))

# Keep both CTRL/STIM groups in tutorial subset so group contrasts are always available.
if ("stim" %in% colnames(seu@meta.data)) {
  grp <- as.character(seu$stim)
  grp_levels <- unique(grp)
  n_target <- min(5000L, ncol(seu))
  n_each <- max(1L, floor(n_target / length(grp_levels)))
  cells_use <- unlist(lapply(grp_levels, function(g) {
    ids <- colnames(seu)[grp == g]
    ids[seq_len(min(length(ids), n_each))]
  }), use.names = FALSE)
  if (length(cells_use) < n_target) {
    rem <- setdiff(colnames(seu), cells_use)
    cells_use <- c(cells_use, rem[seq_len(min(length(rem), n_target - length(cells_use)))])
  }
} else {
  cells_use <- colnames(seu)[seq_len(min(5000L, ncol(seu)))]
}
seu <- subset(seu, cells = cells_use)

dim(seu)
#> [1] 14053  5000
seu
#> An object of class Seurat
#> 14053 features across 5000 samples within 1 assay
#> Active assay: RNA (14053 features, 0 variable features)
#>  2 layers present: counts, data
2) Set analysis columns and consistent palettes
seu$sample <- as.character(seu$orig.ident)
if ("stim" %in% colnames(seu@meta.data)) {
  seu$group <- tolower(as.character(seu$stim))
} else {
  seu$group <- as.character(seu$orig.ident)
}
seu$celltype <- as.character(seu$seurat_annotations)

celltype_levels <- names(sort(table(seu$celltype), decreasing = TRUE))
if (all(c("ctrl", "stim") %in% unique(seu$group))) {
  group_levels <- c("ctrl", "stim")
} else {
  group_levels <- unique(seu$group)
}

seu$celltype <- factor(seu$celltype, levels = celltype_levels)
seu$group <- factor(seu$group, levels = group_levels)

pal_celltype <- setNames(get_palette("gleam_discrete", n = length(celltype_levels), continuous = FALSE), celltype_levels)
pal_group <- setNames(get_palette("brewer_set2", n = length(group_levels), continuous = FALSE), group_levels)

table(seu$group)
#>
#> ctrl stim
#> 2500 2500
head(seu@meta.data[, c("sample", "group", "celltype")])
#>                       sample group     celltype
#> AAACATACATTTCC.1 IMMUNE_CTRL  ctrl    CD14 Mono
#> AAACATACCAGAAA.1 IMMUNE_CTRL  ctrl    CD14 Mono
#> AAACATACCTCGCT.1 IMMUNE_CTRL  ctrl    CD14 Mono
#> AAACATACCTGGTA.1 IMMUNE_CTRL  ctrl          pDC
#> AAACATACGATGAA.1 IMMUNE_CTRL  ctrl CD4 Memory T
#> AAACATACGGCATT.1 IMMUNE_CTRL  ctrl    CD14 Mono
3) Standard Seurat preprocessing
seu <- NormalizeData(seu, verbose = FALSE)
seu <- FindVariableFeatures(seu, verbose = FALSE)
seu <- ScaleData(seu, verbose = FALSE)
seu <- RunPCA(seu, verbose = FALSE)
seu <- FindNeighbors(seu, dims = 1:20, verbose = FALSE)
seu <- FindClusters(seu, resolution = 0.5, verbose = FALSE)
seu <- RunUMAP(seu, dims = 1:20, verbose = FALSE)
#> Warning: The default method for RunUMAP has changed from calling Python UMAP via reticulate to the R-native UWOT using the cosine metric
#> To use Python UMAP via reticulate, set umap.method to 'umap-learn' and metric to 'correlation'
#> This message will be shown once per session
seu <- RunTSNE(seu, dims = 1:20, verbose = FALSE)

ElbowPlot(seu, ndims = 30)
4) UMAP and tSNE overview
DimPlot(seu, reduction = "umap", group.by = "celltype", cols = pal_celltype, pt.size = 0.35) +
  ggplot2::labs(title = "UMAP by cell type")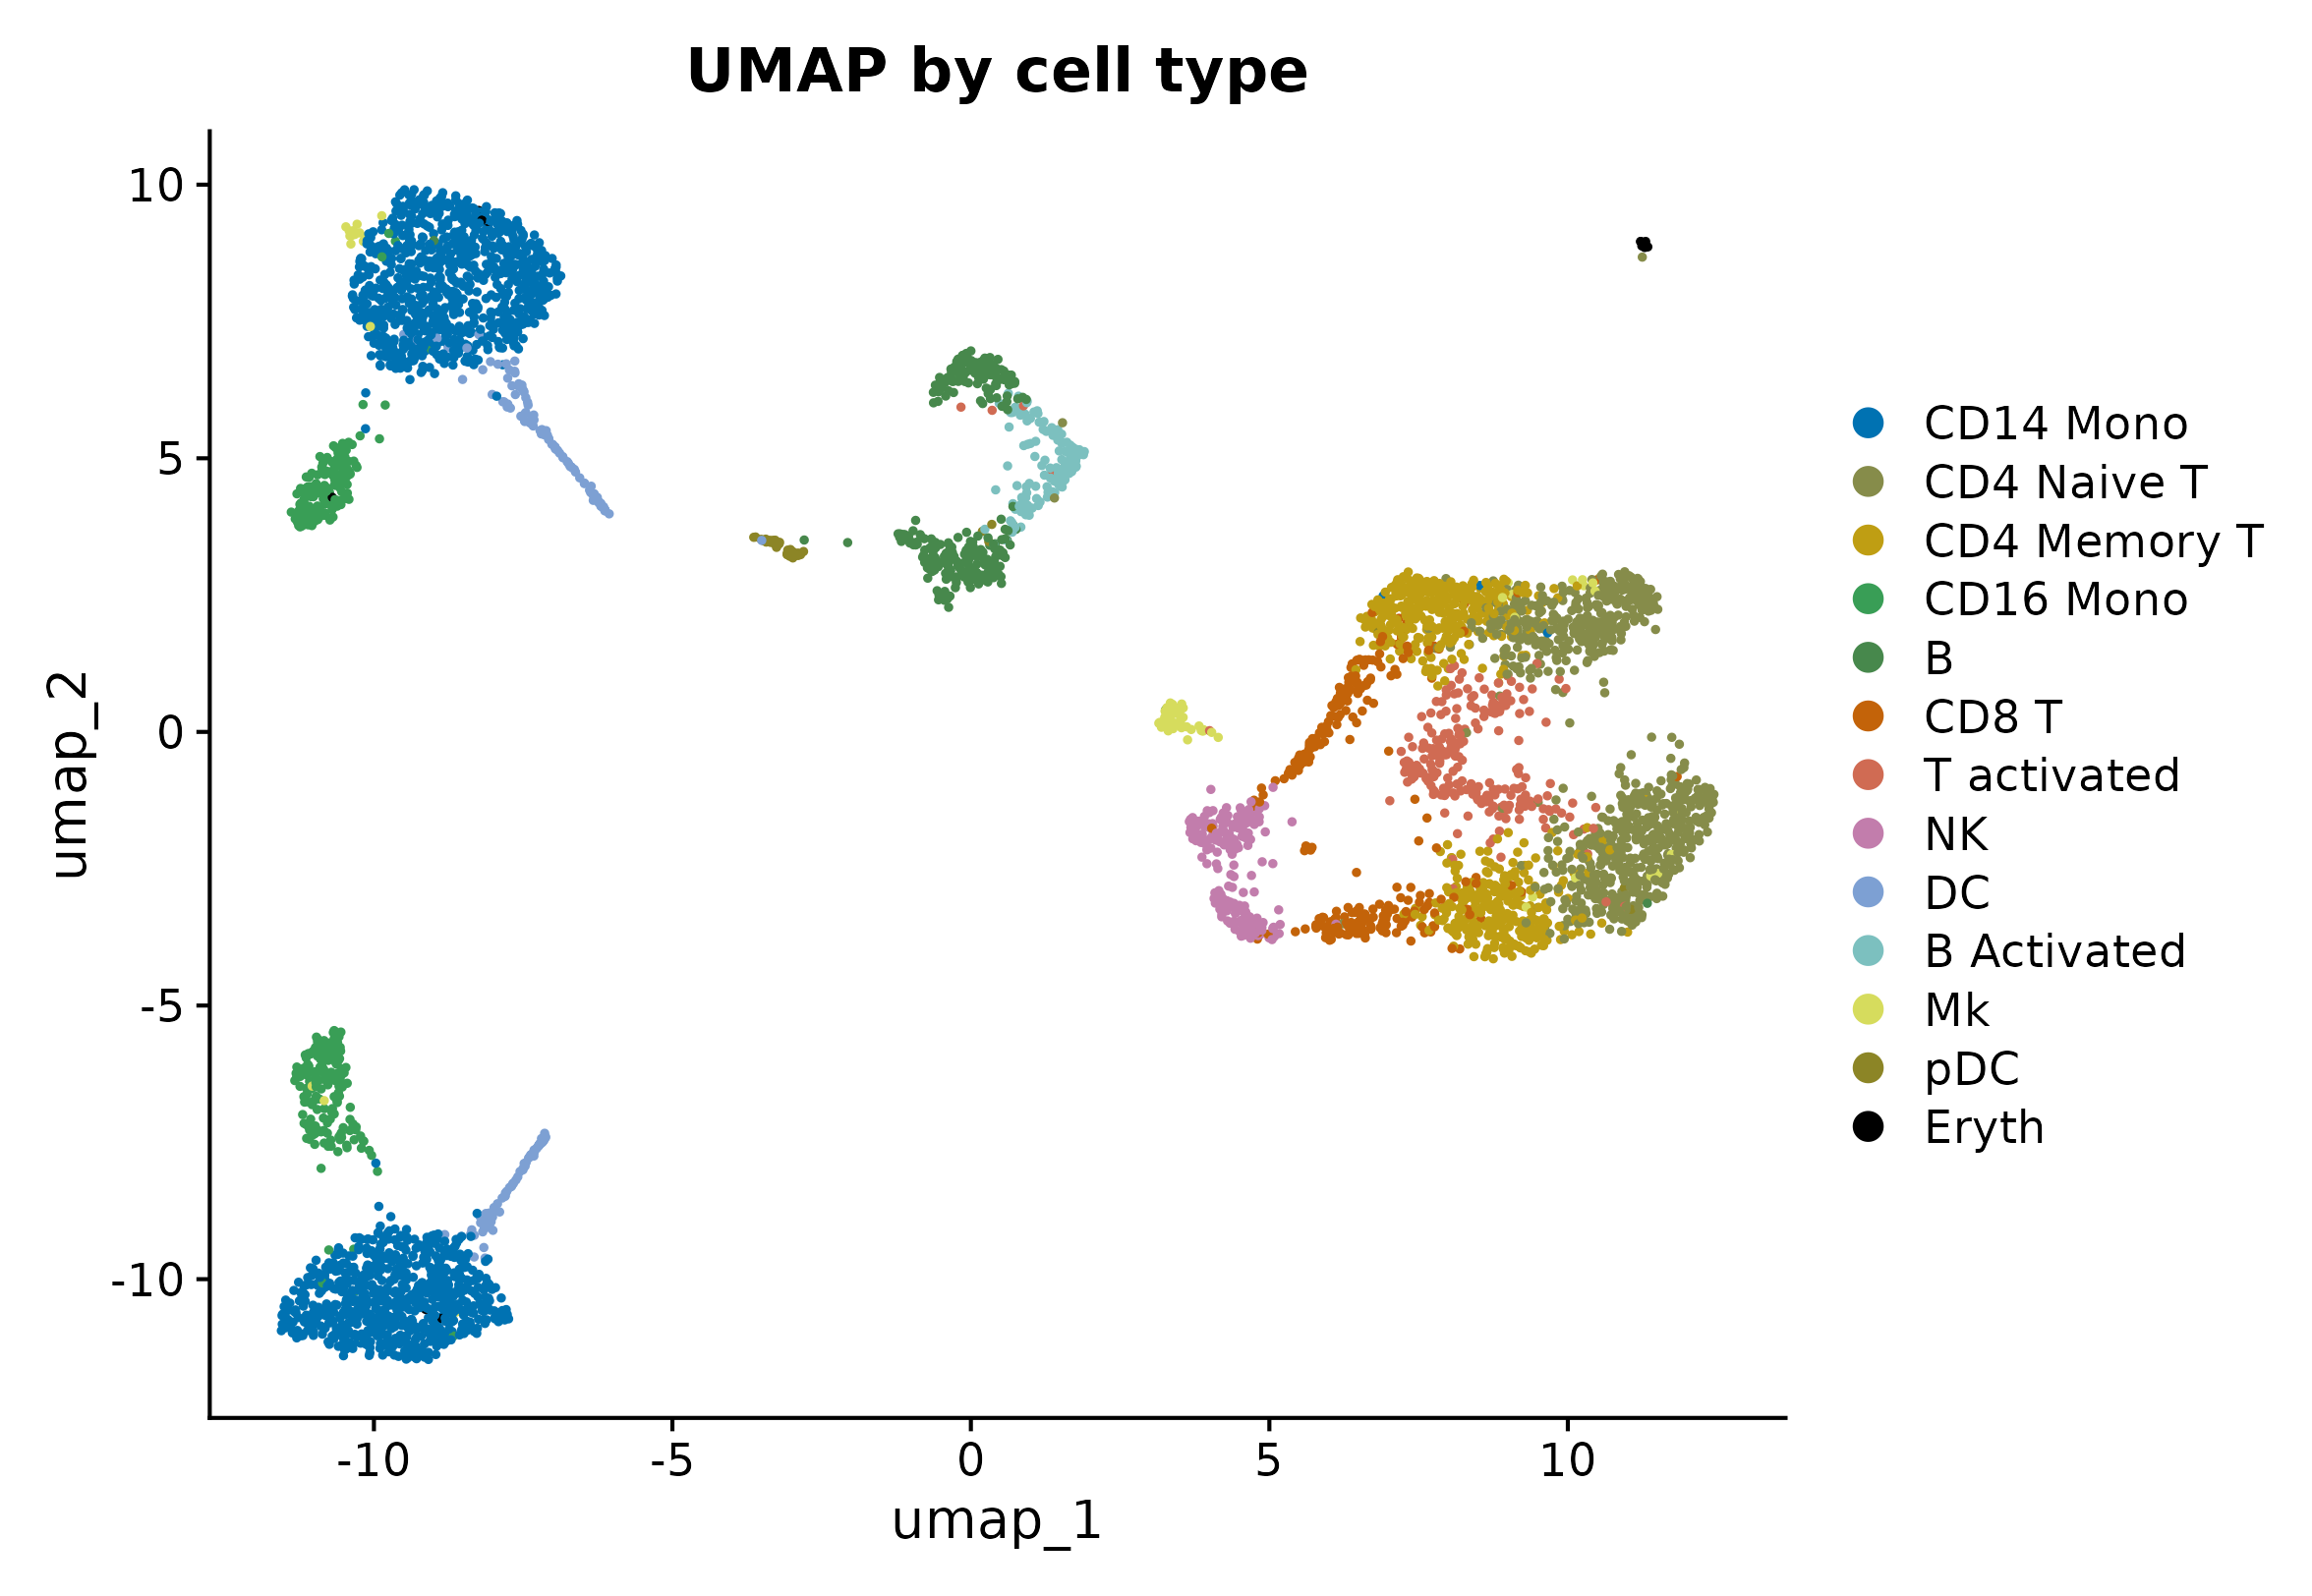
DimPlot(seu, reduction = "umap", group.by = "group", cols = pal_group, pt.size = 0.35) +
  ggplot2::labs(title = "UMAP by condition (ctrl/stim)")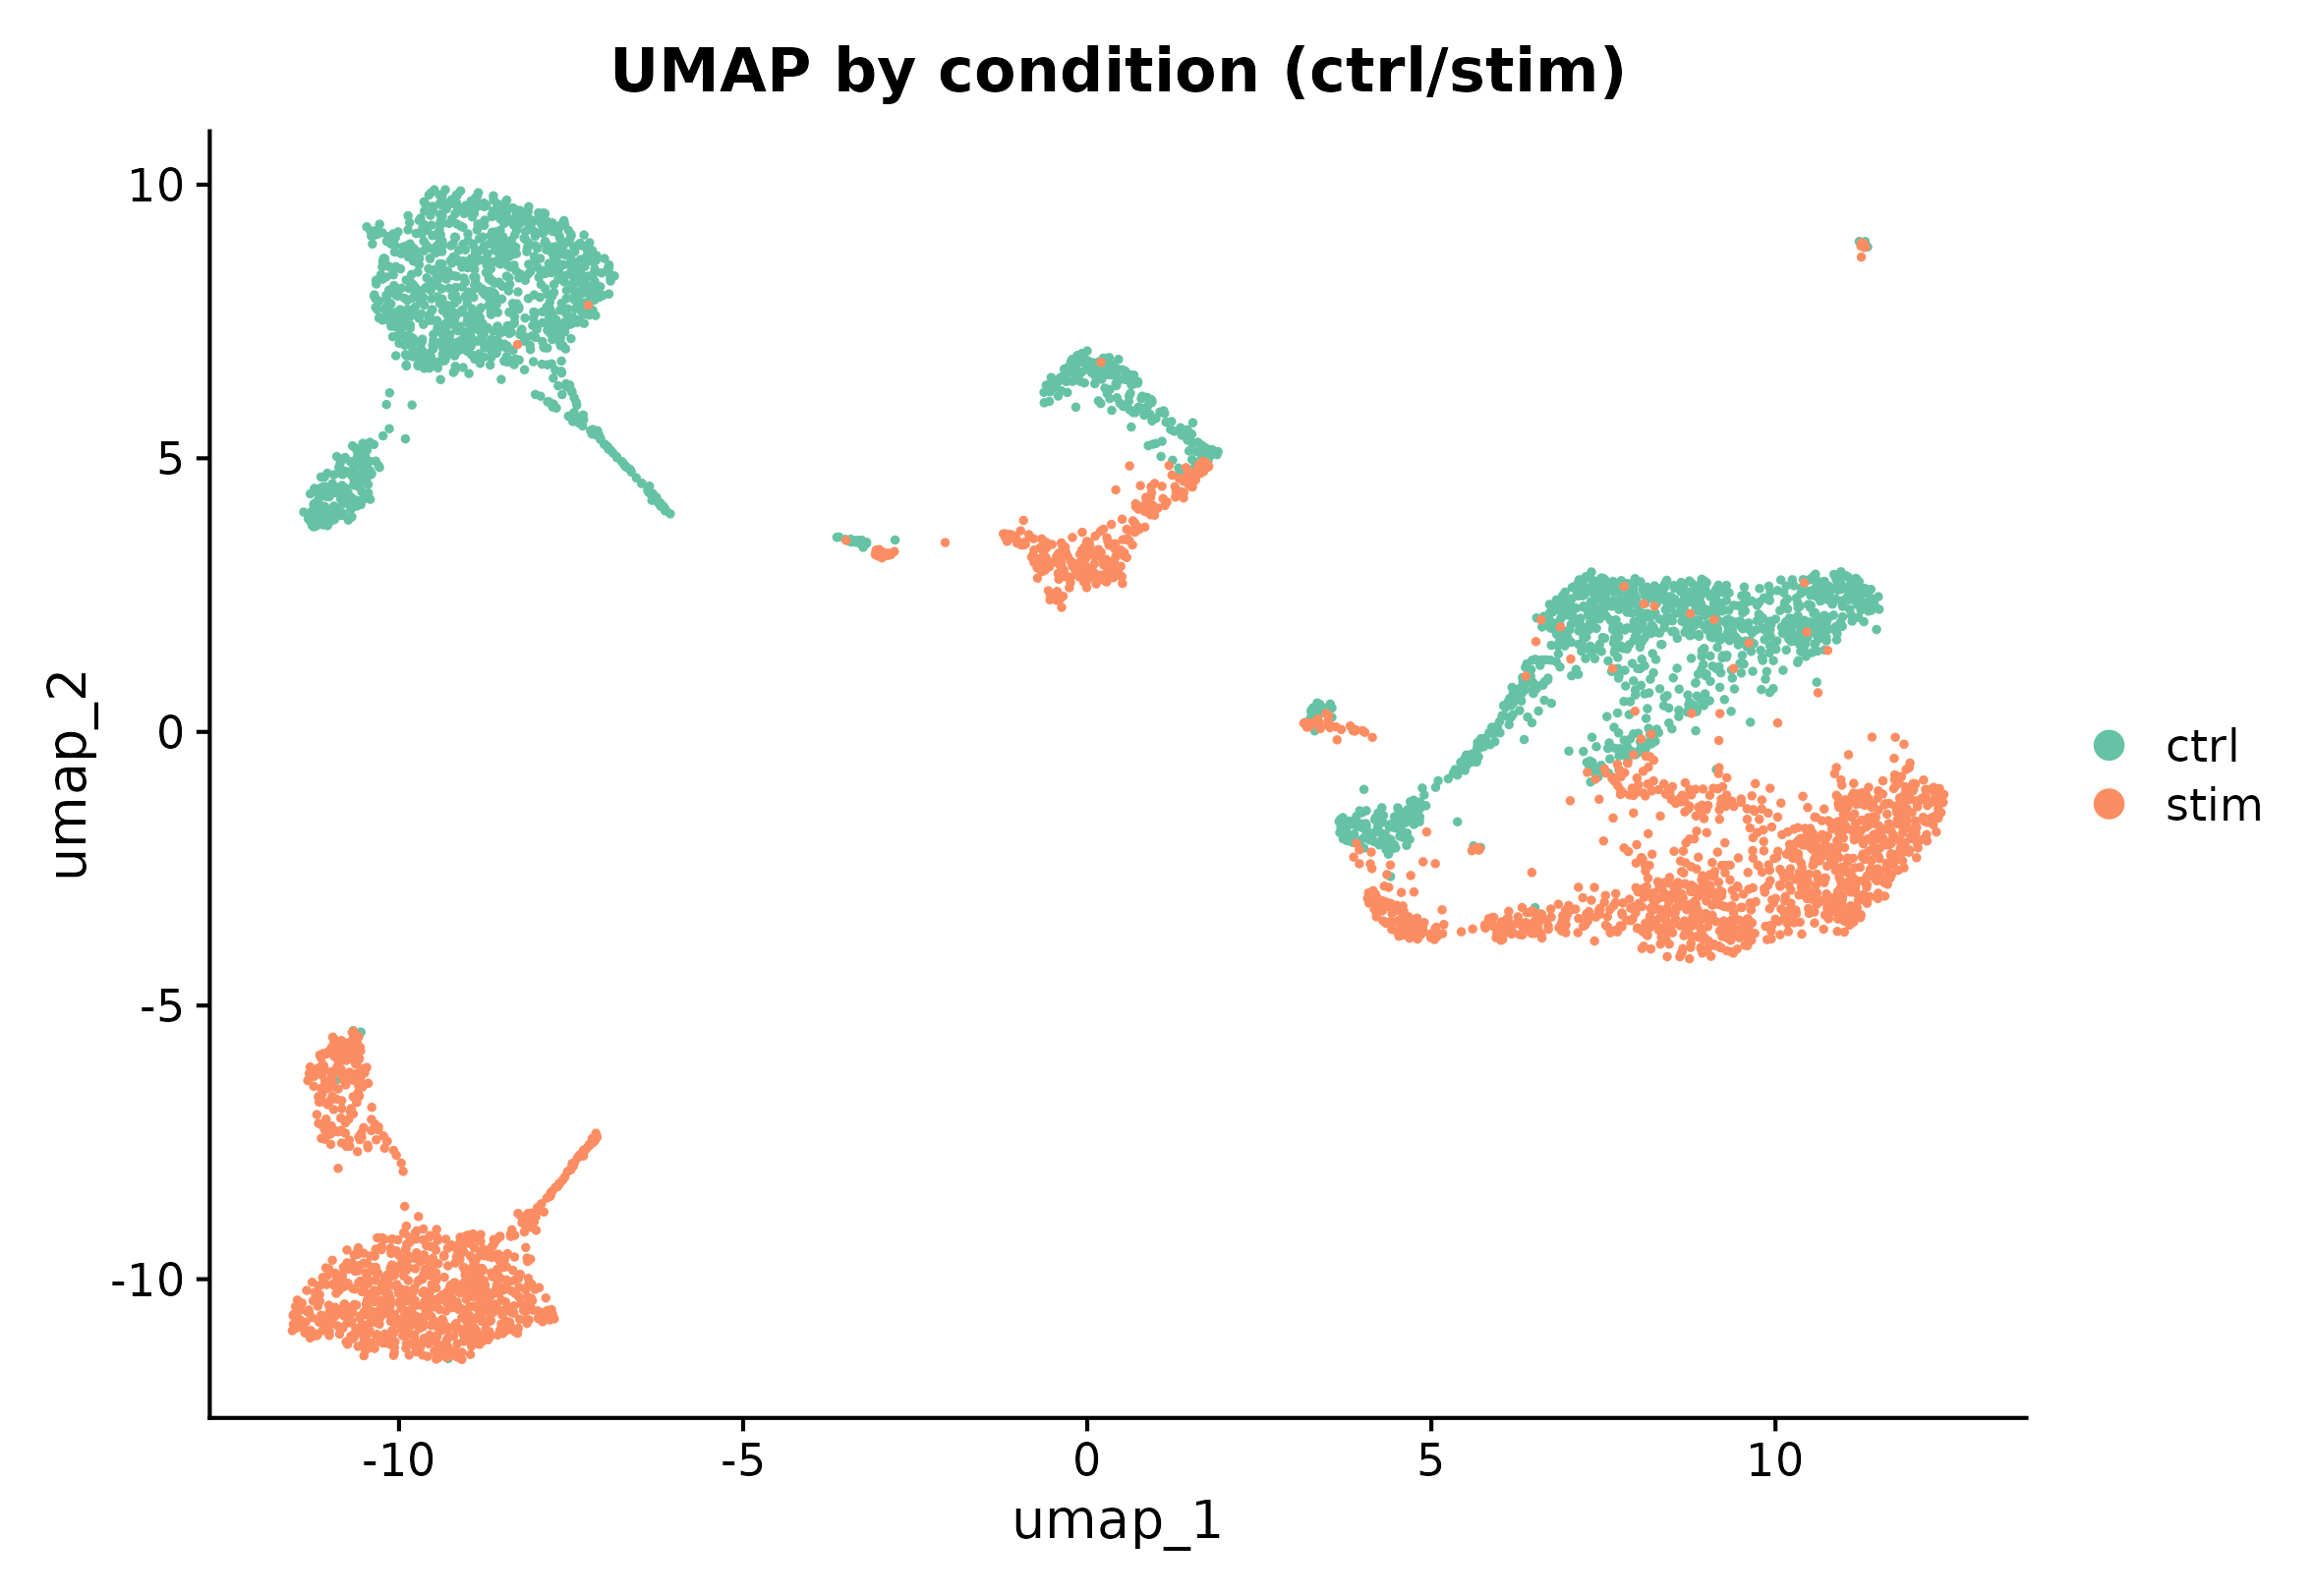
DimPlot(seu, reduction = "tsne", group.by = "group", cols = pal_group, pt.size = 0.35) +
  ggplot2::labs(title = "tSNE by condition (ctrl/stim)")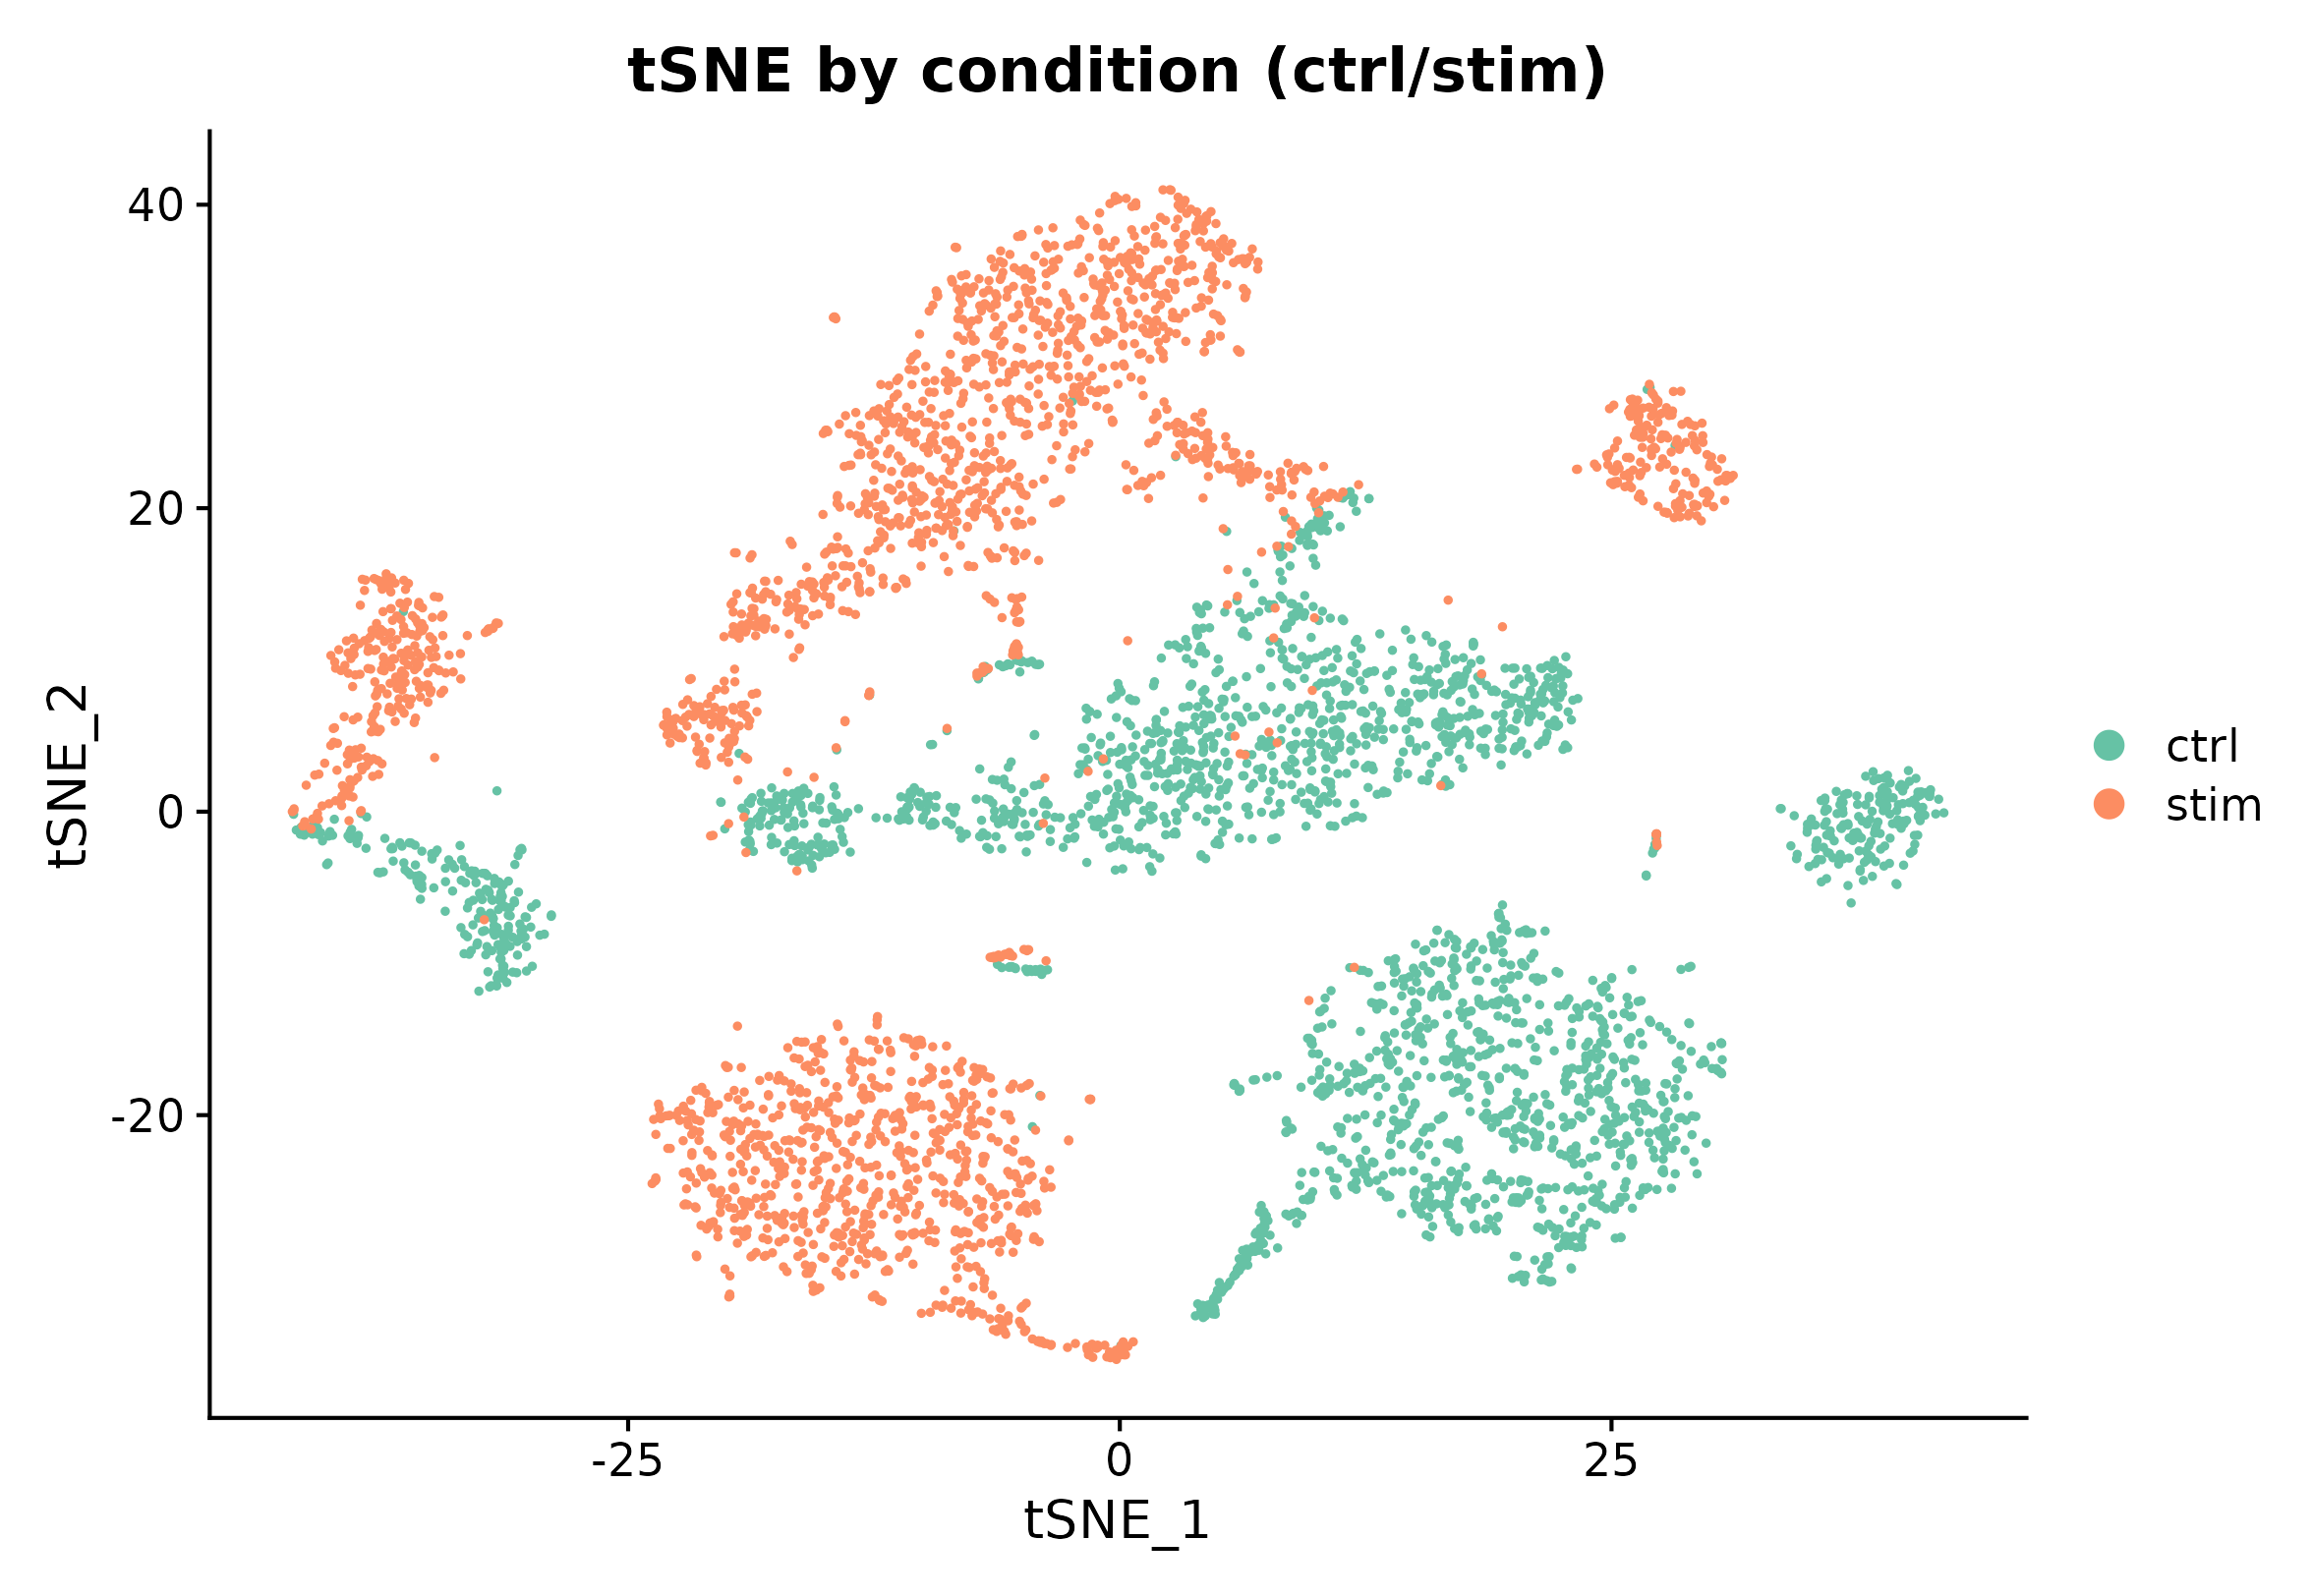
5) Signature scoring
gs <- get_geneset("hallmark", source = "builtin", species = "human")

sc <- score_signature(
  object = seu,
  geneset = gs,
  geneset_source = "list",
  seurat = TRUE,
  assay = "RNA",
  layer = "data",
  slot = "data",
  method = "ensemble",
  min_genes = 3,
  verbose = FALSE
)

sc$meta$celltype <- factor(as.character(sc$meta$celltype), levels = celltype_levels)
sc$meta$group <- factor(as.character(sc$meta$group), levels = group_levels)

dim(sc$score)
#> [1]    5 5000
6) Gene-set databases (expanded)
list_geneset_sources()
#>          source requires_package supported_builtin_species built_in_available
#> 1       builtin             <NA>               human,mouse               TRUE
#> 2          list             <NA>               any(custom)              FALSE
#> 3           gmt             <NA>               any(custom)              FALSE
#> 4    data.frame             <NA>               any(custom)              FALSE
#> 5        msigdb          msigdbr               human,mouse              FALSE
#> 6            go          msigdbr               human,mouse              FALSE
#> 7          kegg          msigdbr               human,mouse              FALSE
#> 8      reactome          msigdbr               human,mouse              FALSE
#> 9  wikipathways          msigdbr               human,mouse              FALSE
#> 10     biocarta          msigdbr               human,mouse              FALSE
#>    internet_required
#> 1              FALSE
#> 2              FALSE
#> 3              FALSE
#> 4              FALSE
#> 5              FALSE
#> 6              FALSE
#> 7              FALSE
#> 8              FALSE
#> 9              FALSE
#> 10             FALSE

if (requireNamespace("msigdbr", quietly = TRUE)) {
  gs_wp <- get_geneset(source = "wikipathways", geneset = "wikipathways", species = "human")
  gs_bc <- get_geneset(source = "biocarta", geneset = "biocarta", species = "human")
  c(
    wikipathways = length(gs_wp),
    biocarta = length(gs_bc)
  )
}
7) Differential analysis
res_pb <- test_signature(
sc,
group = "group",
sample = "sample",
celltype = "celltype",
level = "pseudobulk",
method = "wilcox"
)
top_sig <- res_pb$table$pathway[order(res_pb$table$p_adj)][1]
head(res_pb$table)
#> pathway comparison_type group1 group2
#> 1 HALLMARK_APOPTOSIS pseudobulk ctrl stim
#> 2 HALLMARK_IL6_JAK_STAT3_SIGNALING pseudobulk ctrl stim
#> 3 HALLMARK_INFLAMMATORY_RESPONSE pseudobulk ctrl stim
#> 4 HALLMARK_INTERFERON_GAMMA_RESPONSE pseudobulk ctrl stim
#> 5 HALLMARK_OXIDATIVE_PHOSPHORYLATION pseudobulk ctrl stim
#> celltype
#> 1 B;B Activated;CD14 Mono;CD16 Mono;CD4 Memory T;CD4 Naive T;CD8 T;DC;Eryth;Mk;NK;pDC;T activated
#> 2 B;B Activated;CD14 Mono;CD16 Mono;CD4 Memory T;CD4 Naive T;CD8 T;DC;Eryth;Mk;NK;pDC;T activated
#> 3 B;B Activated;CD14 Mono;CD16 Mono;CD4 Memory T;CD4 Naive T;CD8 T;DC;Eryth;Mk;NK;pDC;T activated
#> 4 B;B Activated;CD14 Mono;CD16 Mono;CD4 Memory T;CD4 Naive T;CD8 T;DC;Eryth;Mk;NK;pDC;T activated
#> 5 B;B Activated;CD14 Mono;CD16 Mono;CD4 Memory T;CD4 Naive T;CD8 T;DC;Eryth;Mk;NK;pDC;T activated
#> level effect_size median_group1 median_group2 diff_median p_value
#> 1 pseudobulk -0.06469235 -0.30914632 -0.24445397 -0.06469235 4.793229e-01
#> 2 pseudobulk -0.15232254 -0.10254860 0.04977394 -0.15232254 1.248390e-03
#> 3 pseudobulk -0.05986874 -0.47481564 -0.41494690 -0.05986874 3.358339e-01
#> 4 pseudobulk -1.45054630 -0.85607494 0.59447136 -1.45054630 1.922966e-07
#> 5 pseudobulk 0.01956142 -0.04851678 -0.06807820 0.01956142 1.533835e-01
#> p_adj n_group1 n_group2 mean_group1 mean_group2 direction
#> 1 4.793229e-01 13 13 0.0004961131 0.01732366 down
#> 2 3.120974e-03 13 13 -0.0972541324 0.11437032 down
#> 3 4.197924e-01 13 13 -0.2717065892 -0.17290130 down
#> 4 9.614830e-07 13 13 -0.8724480174 0.73448574 down
#> 5 2.556391e-01 13 13 0.1037860590 -0.12311728 up
top_sig
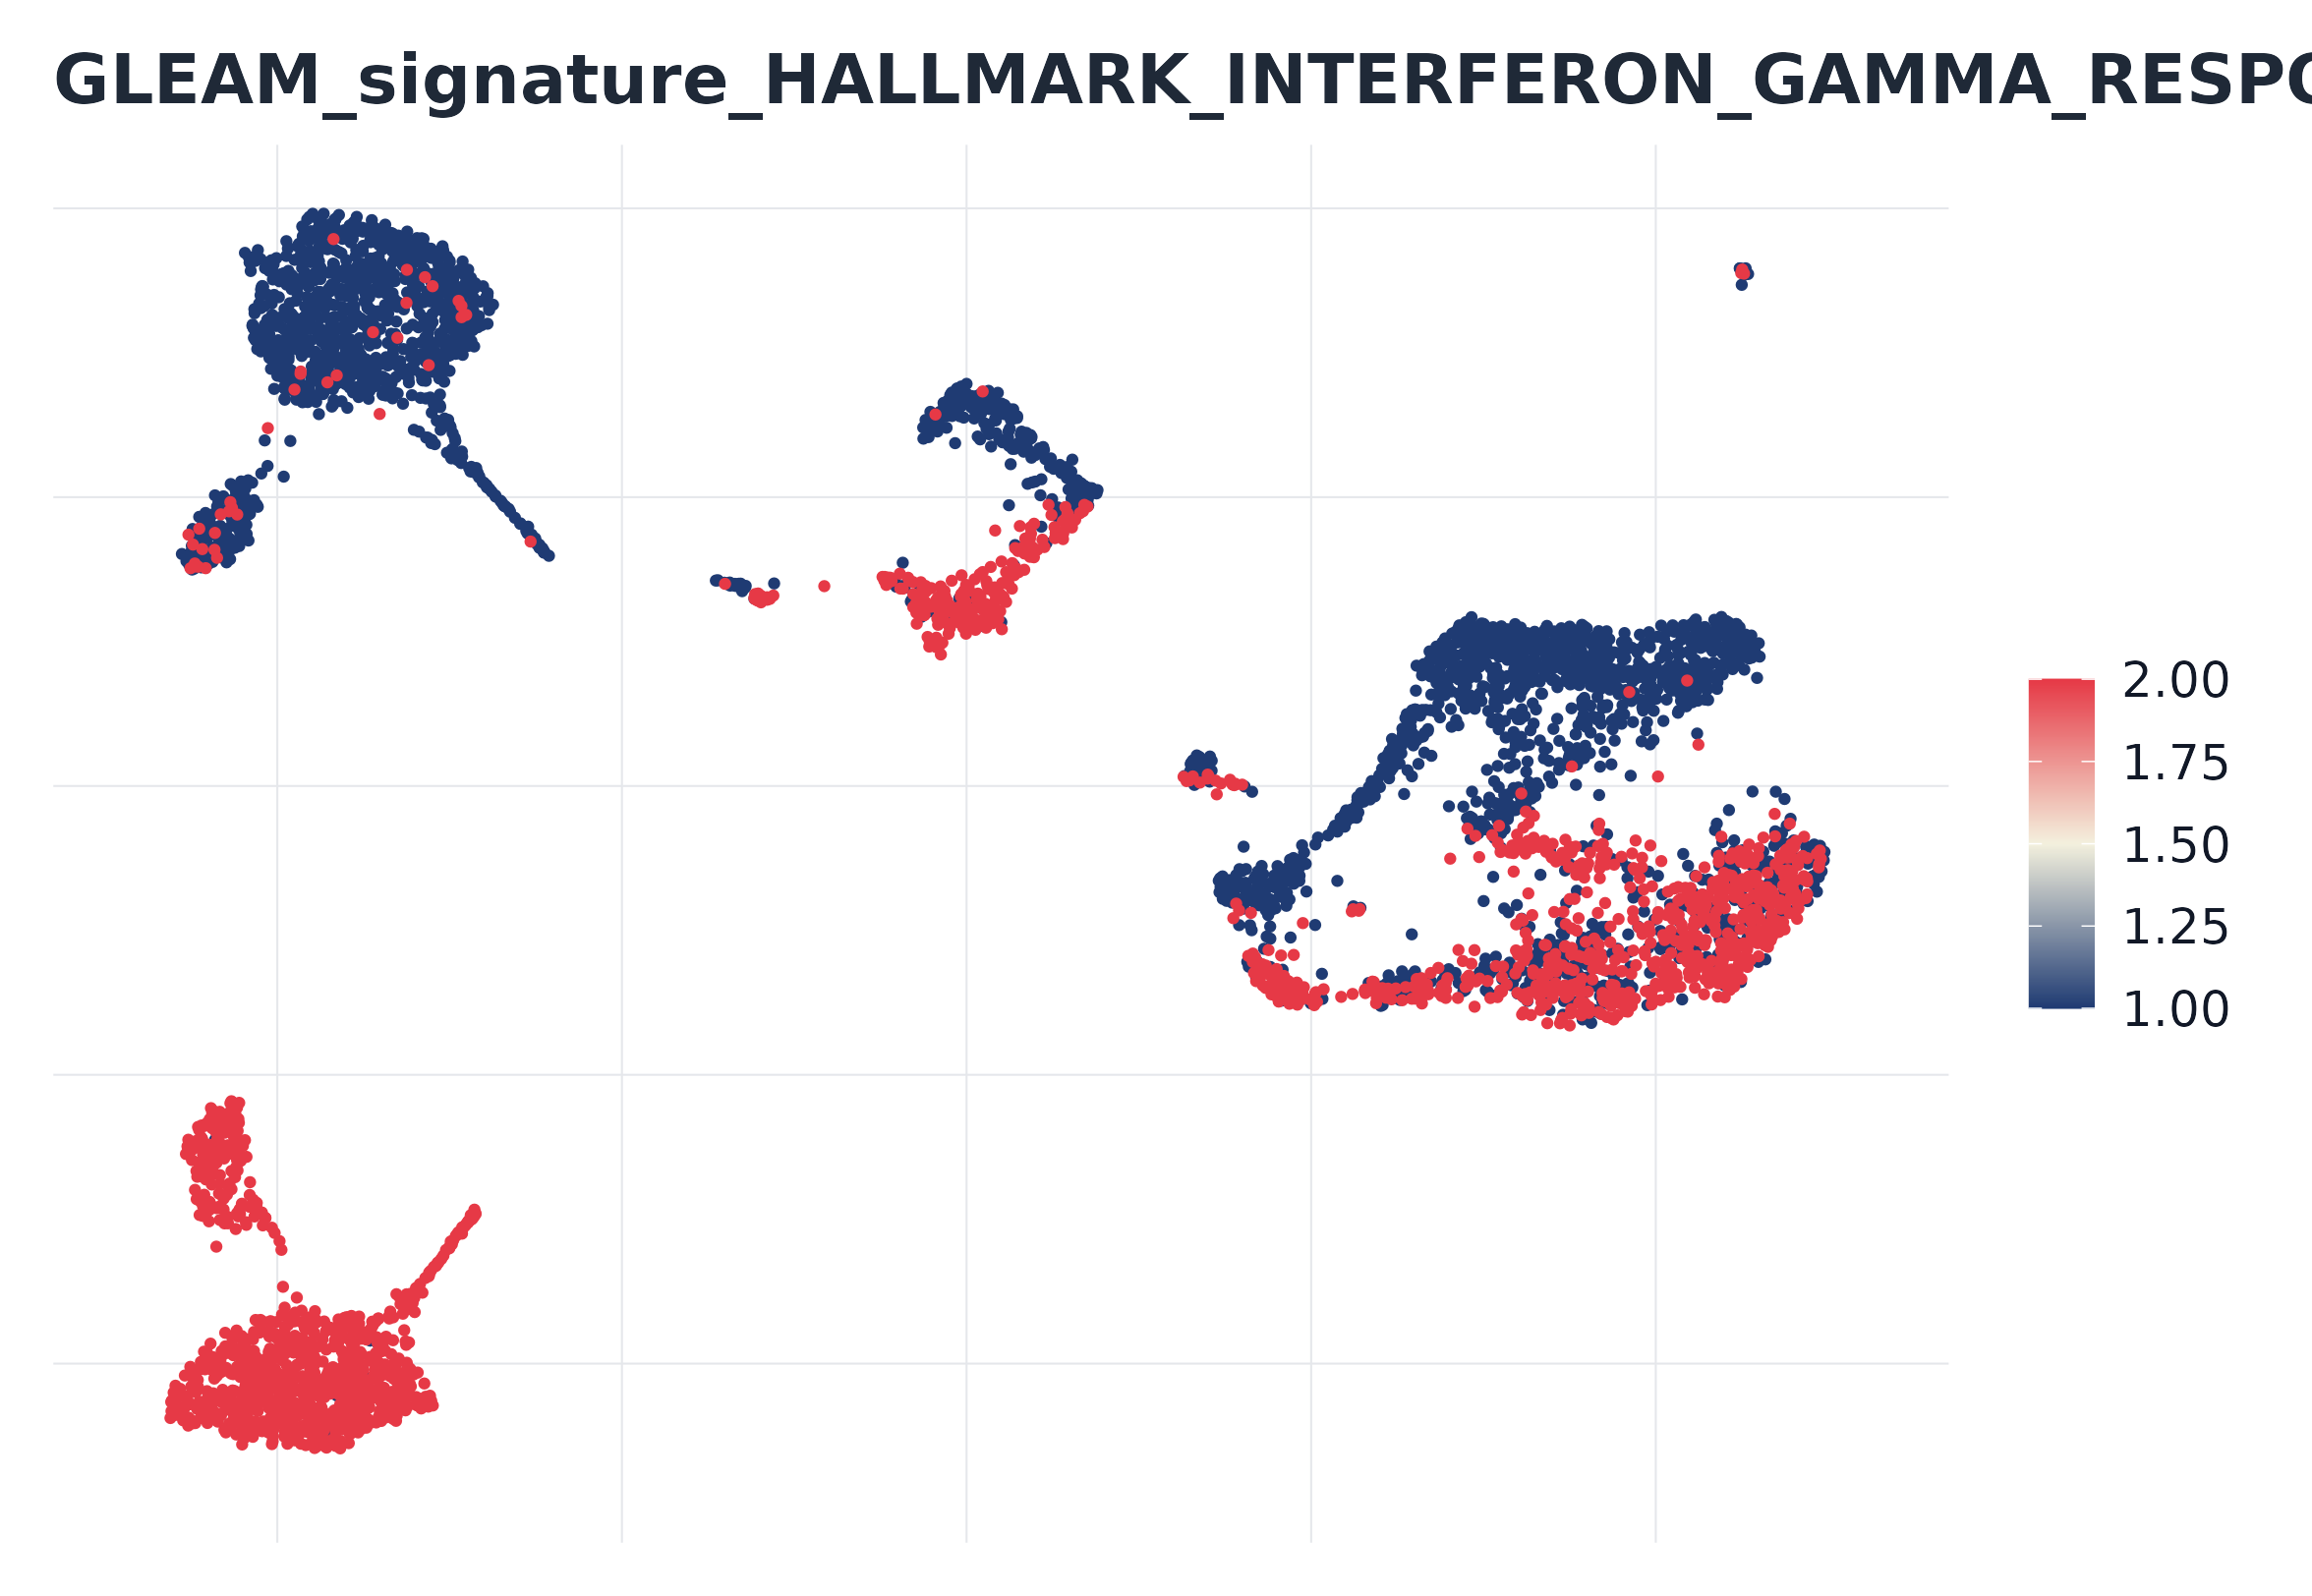
#> [1] "HALLMARK_INTERFERON_GAMMA_RESPONSE"8) GLEAM embedding score plot (Seurat-based)
plot_embedding_score(
  sc,
  signature = top_sig,
  object = seu,
  reduction = "umap",
  point_size = 0.7,
  palette = "gleam_continuous"
)
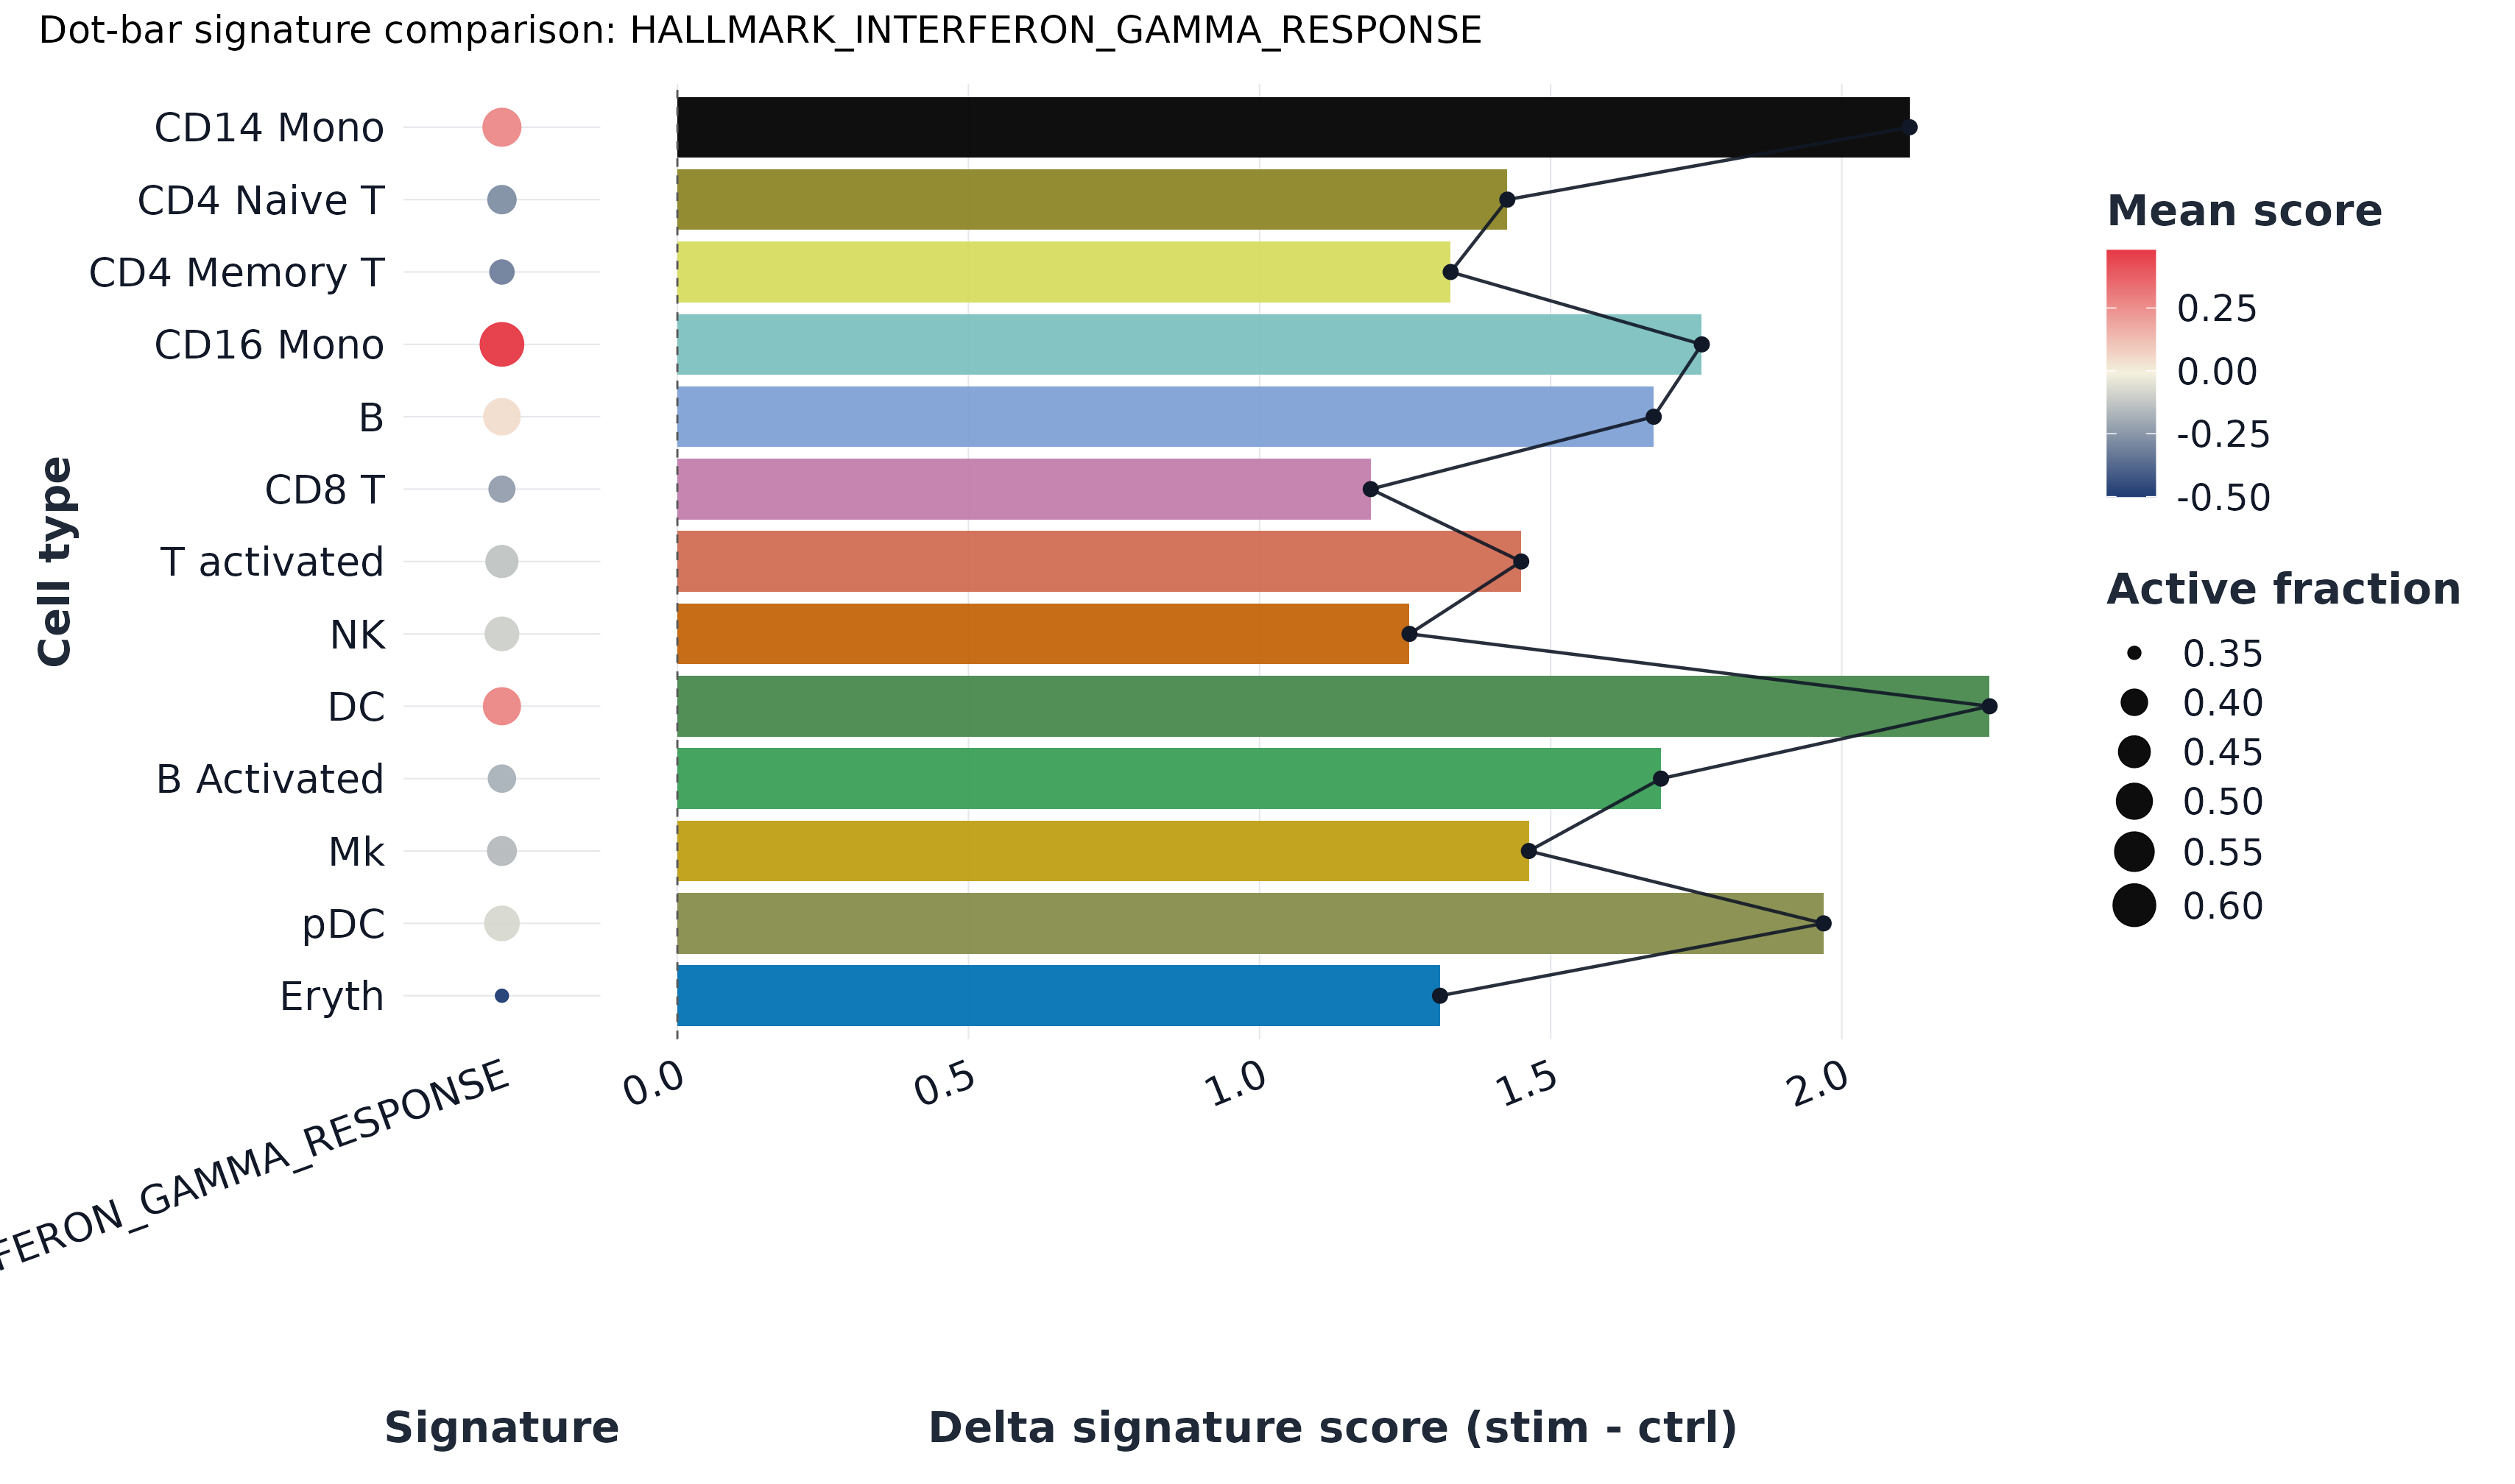
9) Dot-bar plot
plot_dot_bar(
  sc,
  by = c("group", "celltype"),
  signature = top_sig,
  color_palette = "gleam_continuous"
)
10) Violin plot
plot_violin(
  sc,
  signature = top_sig,
  group = "celltype",
  palette = pal_celltype,
  point_size = 0,
  alpha = 0.75
) + ggplot2::theme(axis.text.x = ggplot2::element_text(angle = 28, hjust = 1))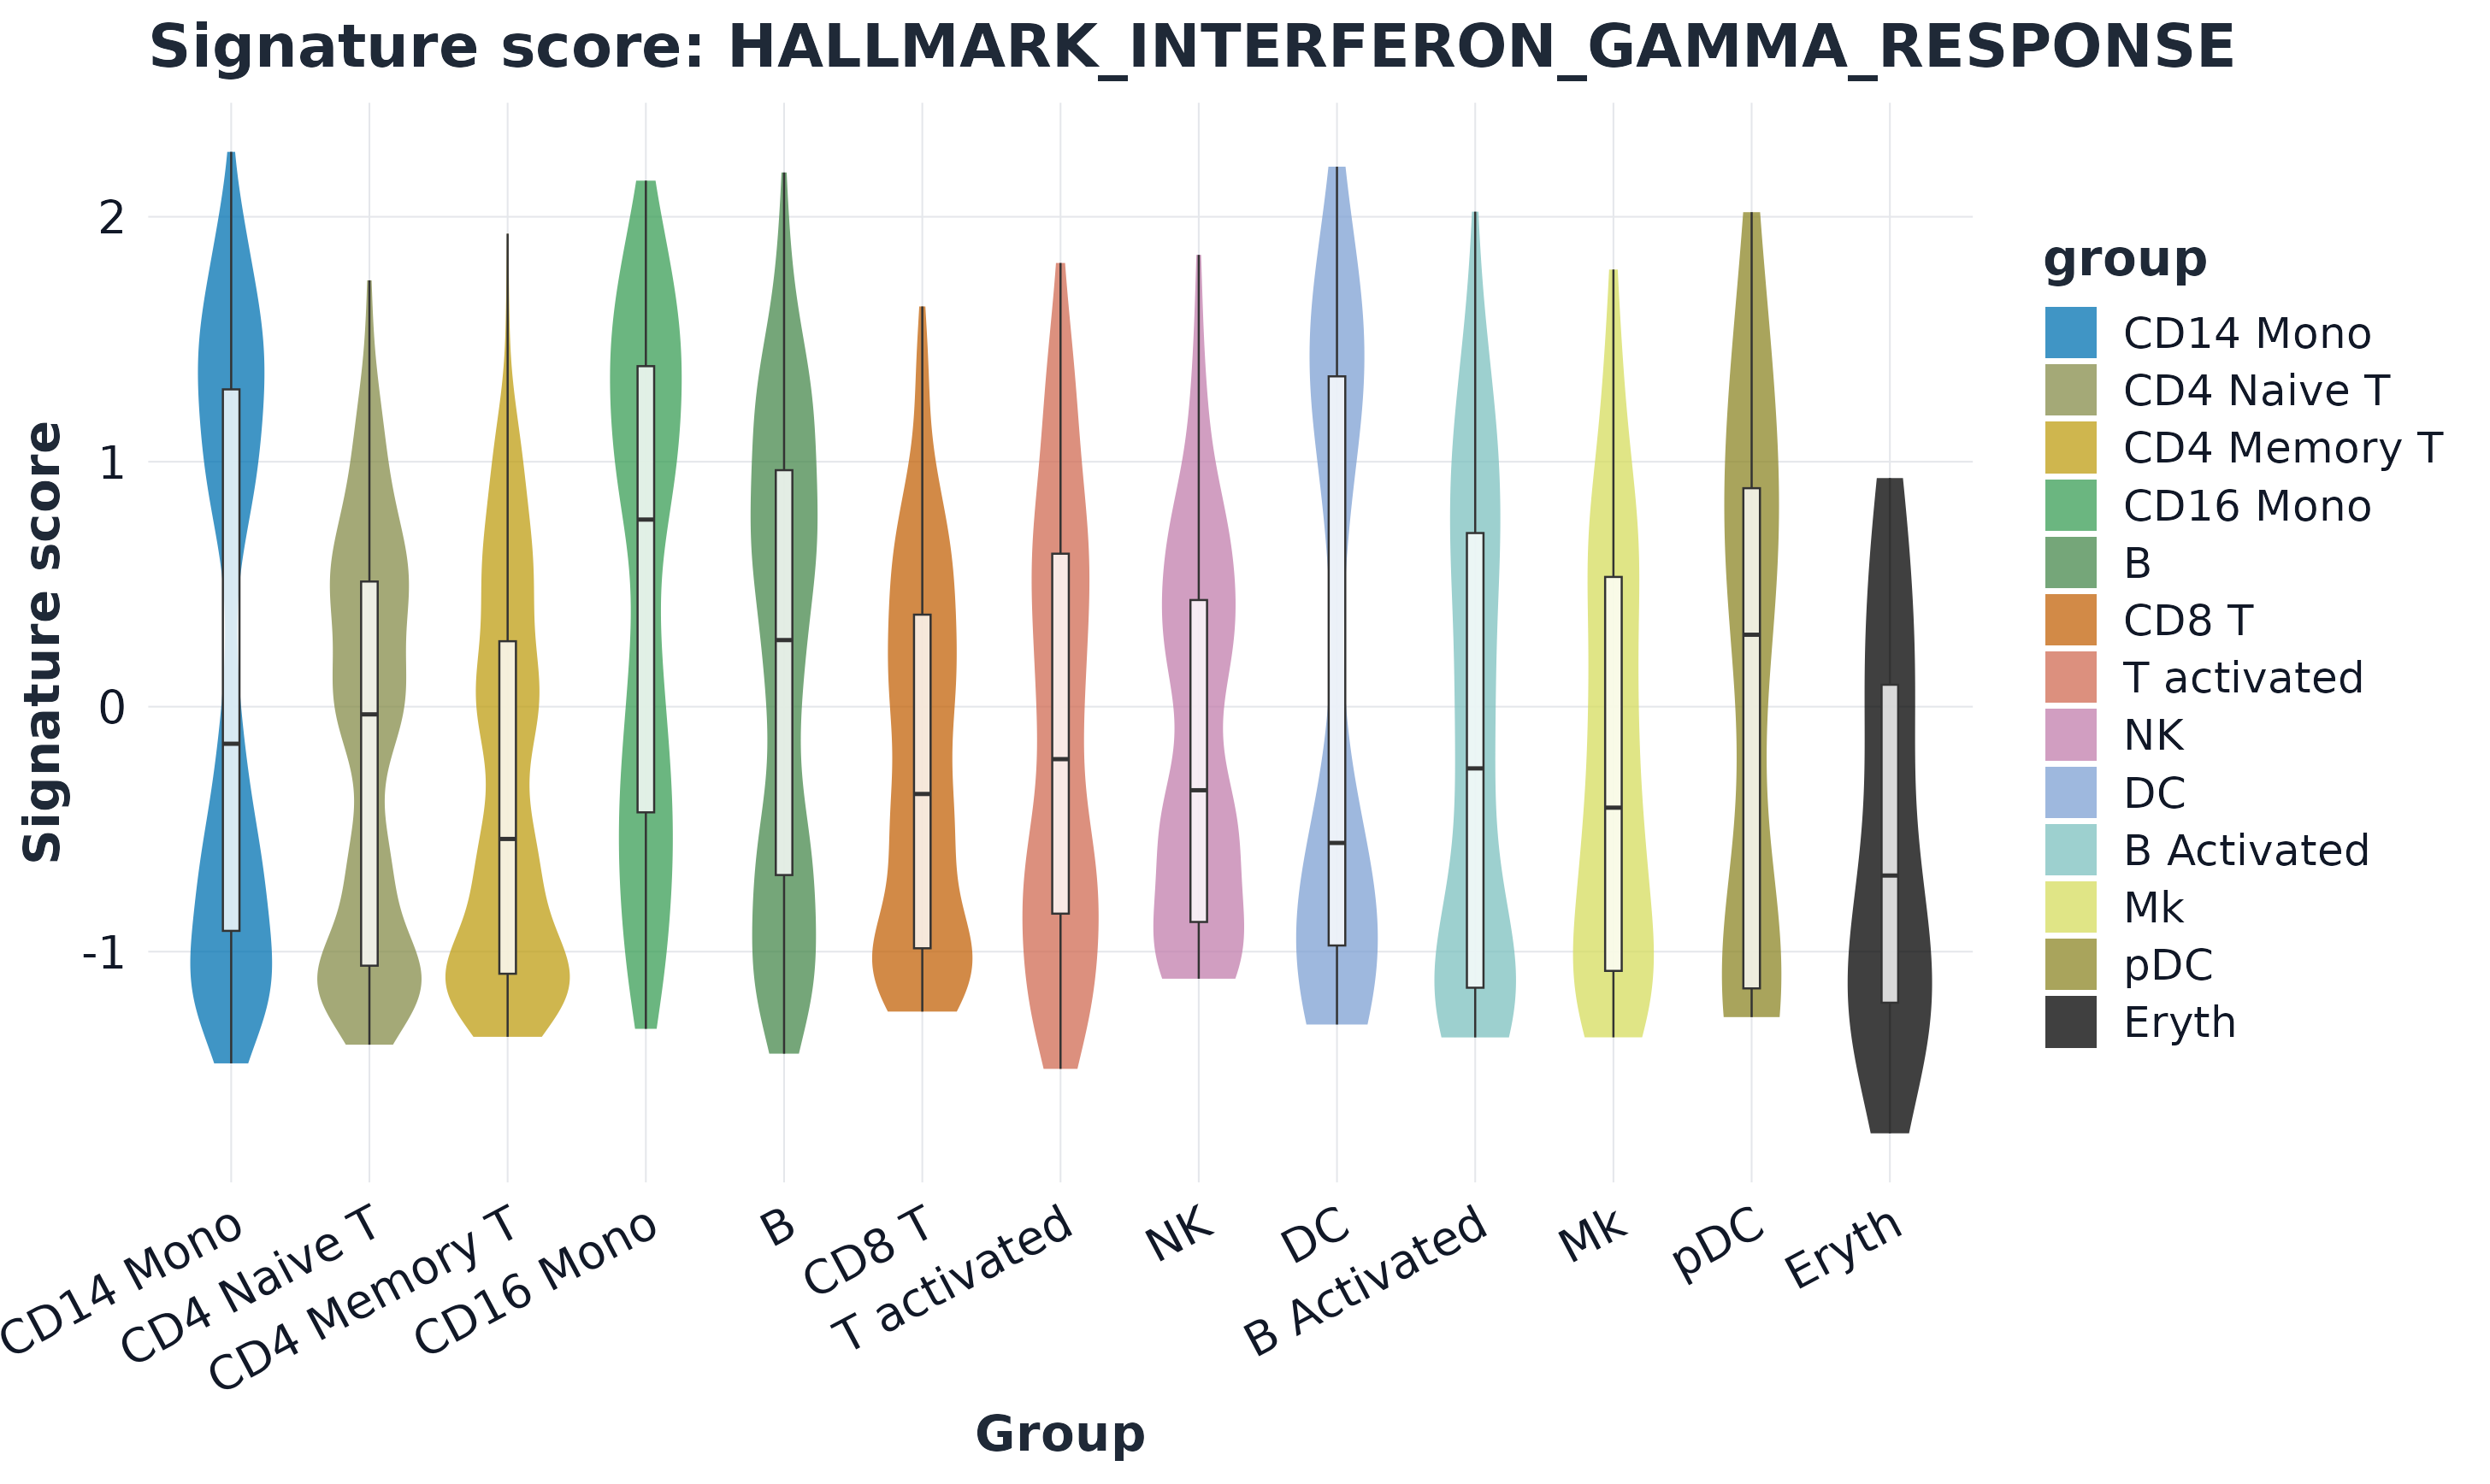
11) Split violin plot
plot_split_violin(
  sc,
  signature = top_sig,
  x = "celltype",
  split.by = "group",
  palette = pal_group,
  alpha = 0.72
) + ggplot2::theme(axis.text.x = ggplot2::element_text(angle = 28, hjust = 1))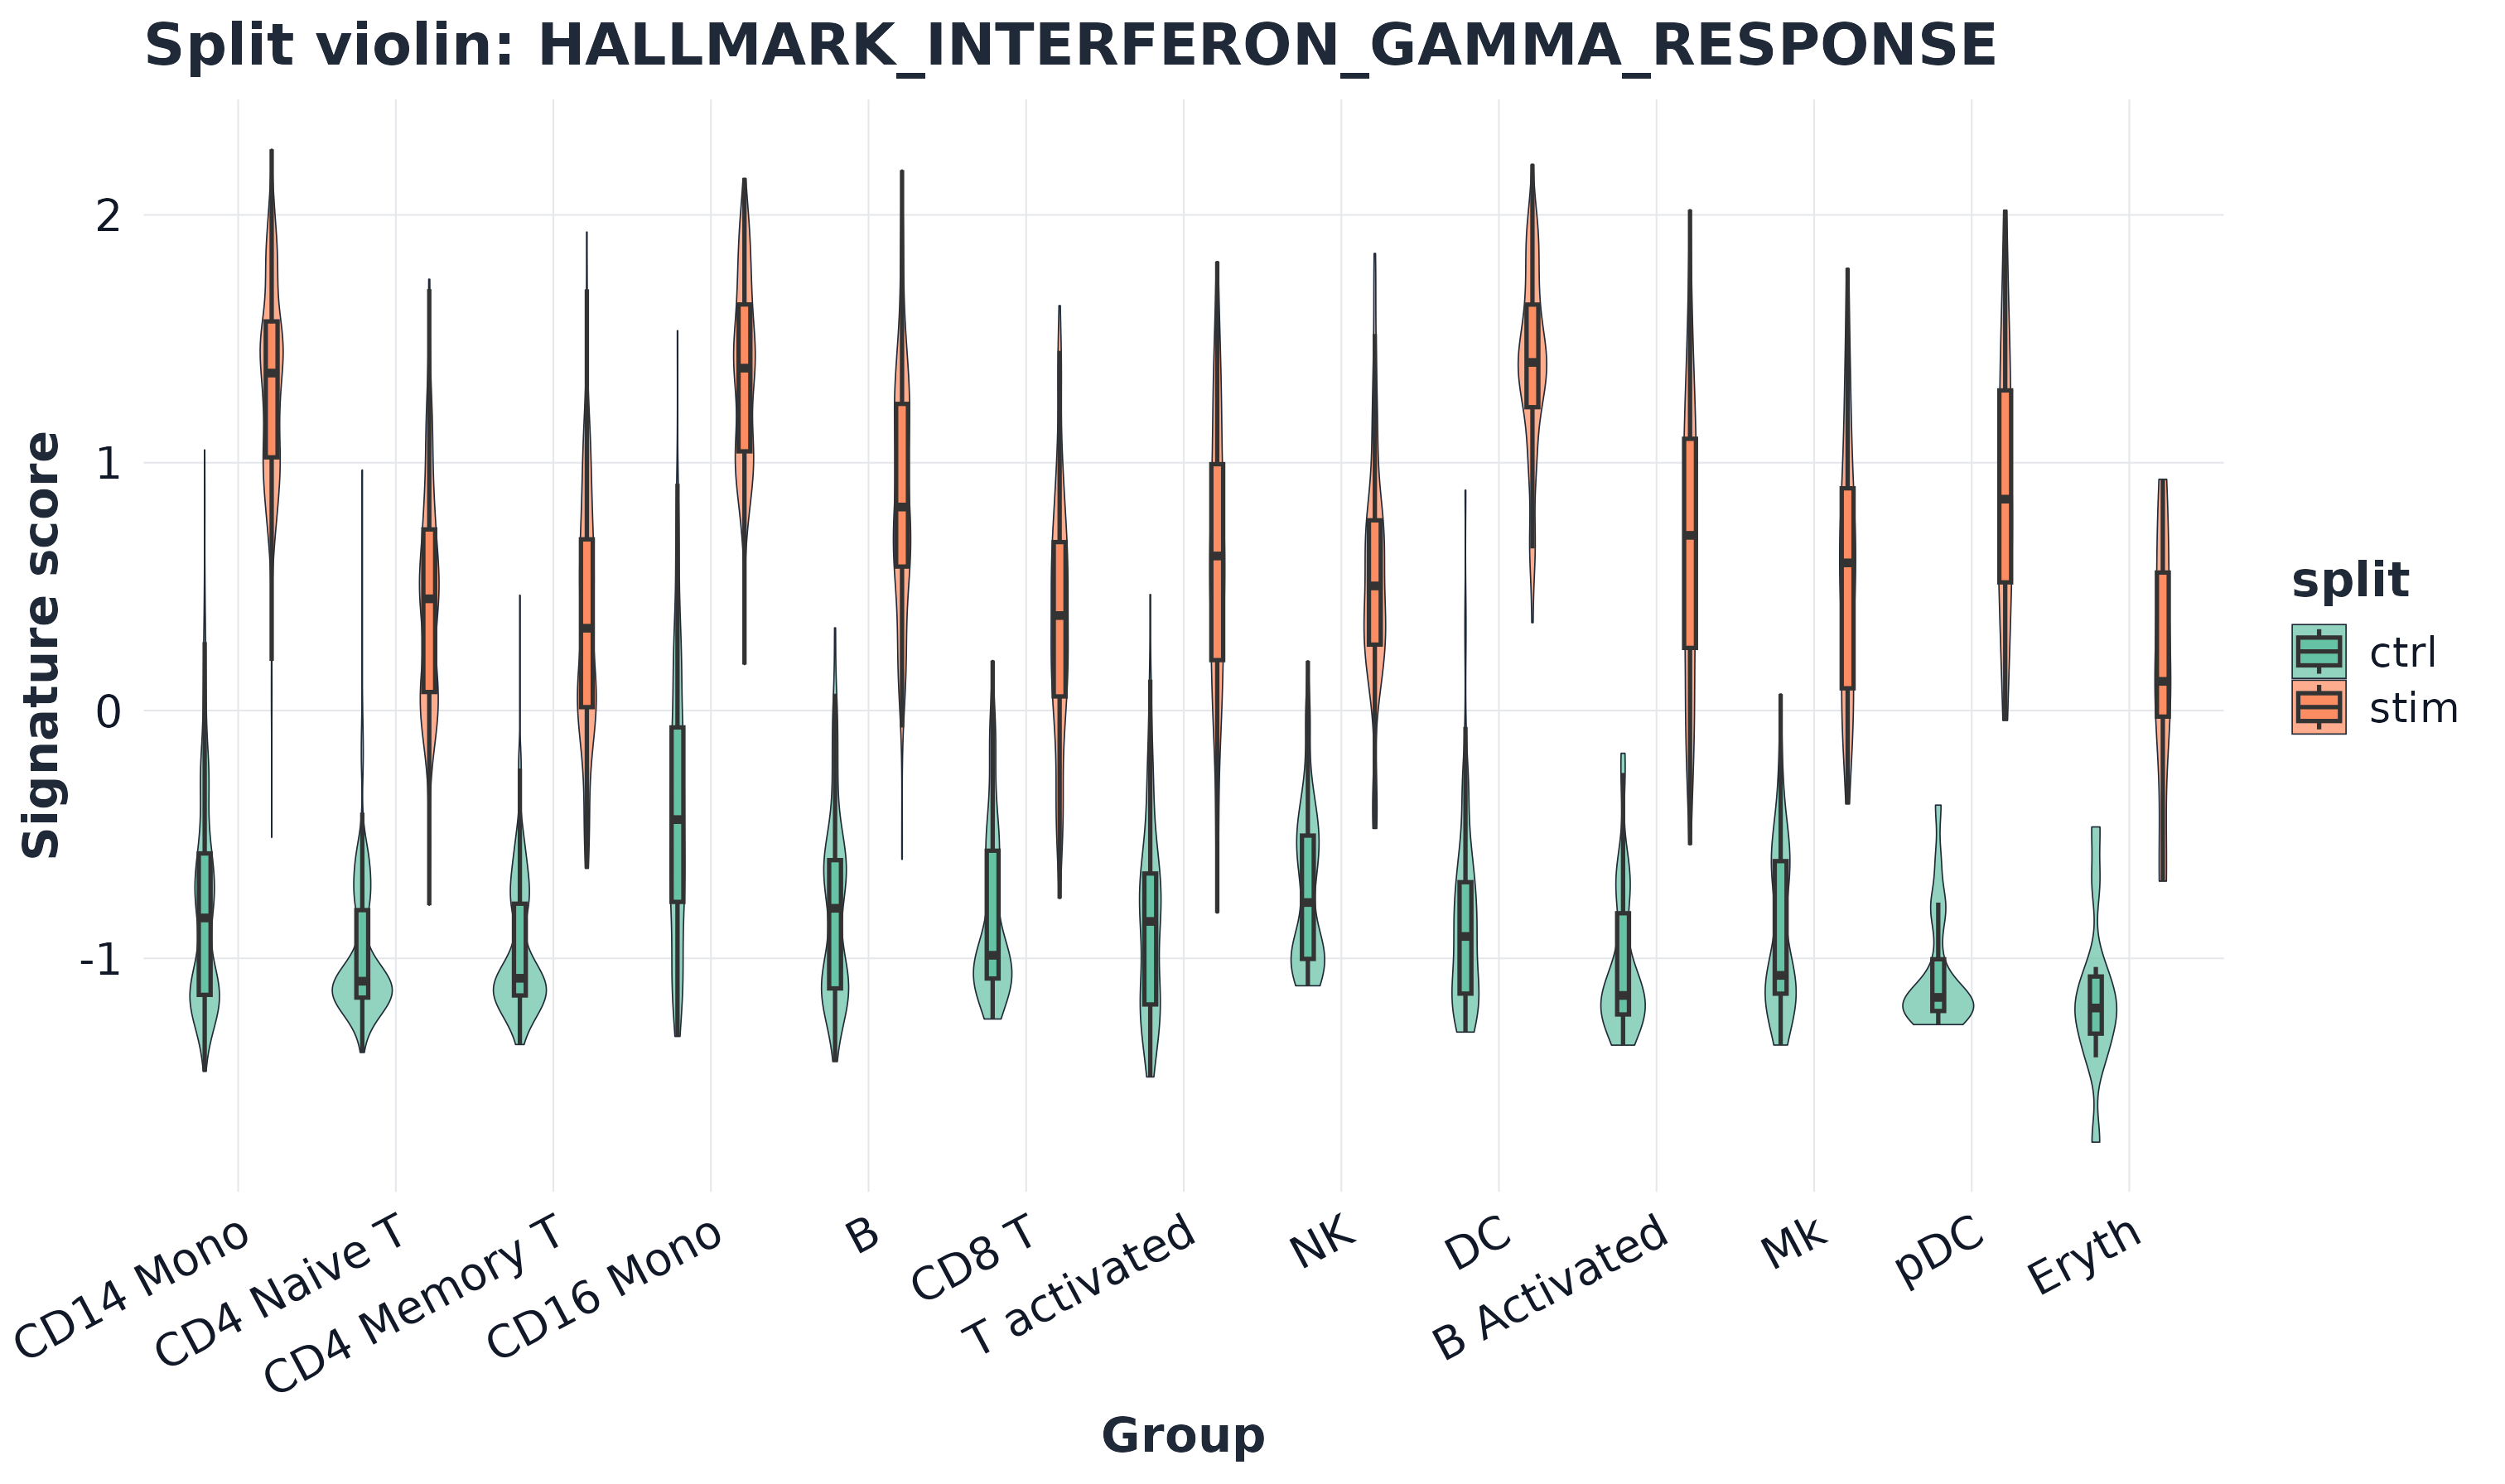
12) Ridge plot
plot_ridge(
  sc,
  signature = top_sig,
  group = "celltype",
  palette = pal_celltype,
  alpha = 0.75
)
#> Picking joint bandwidth of 0.284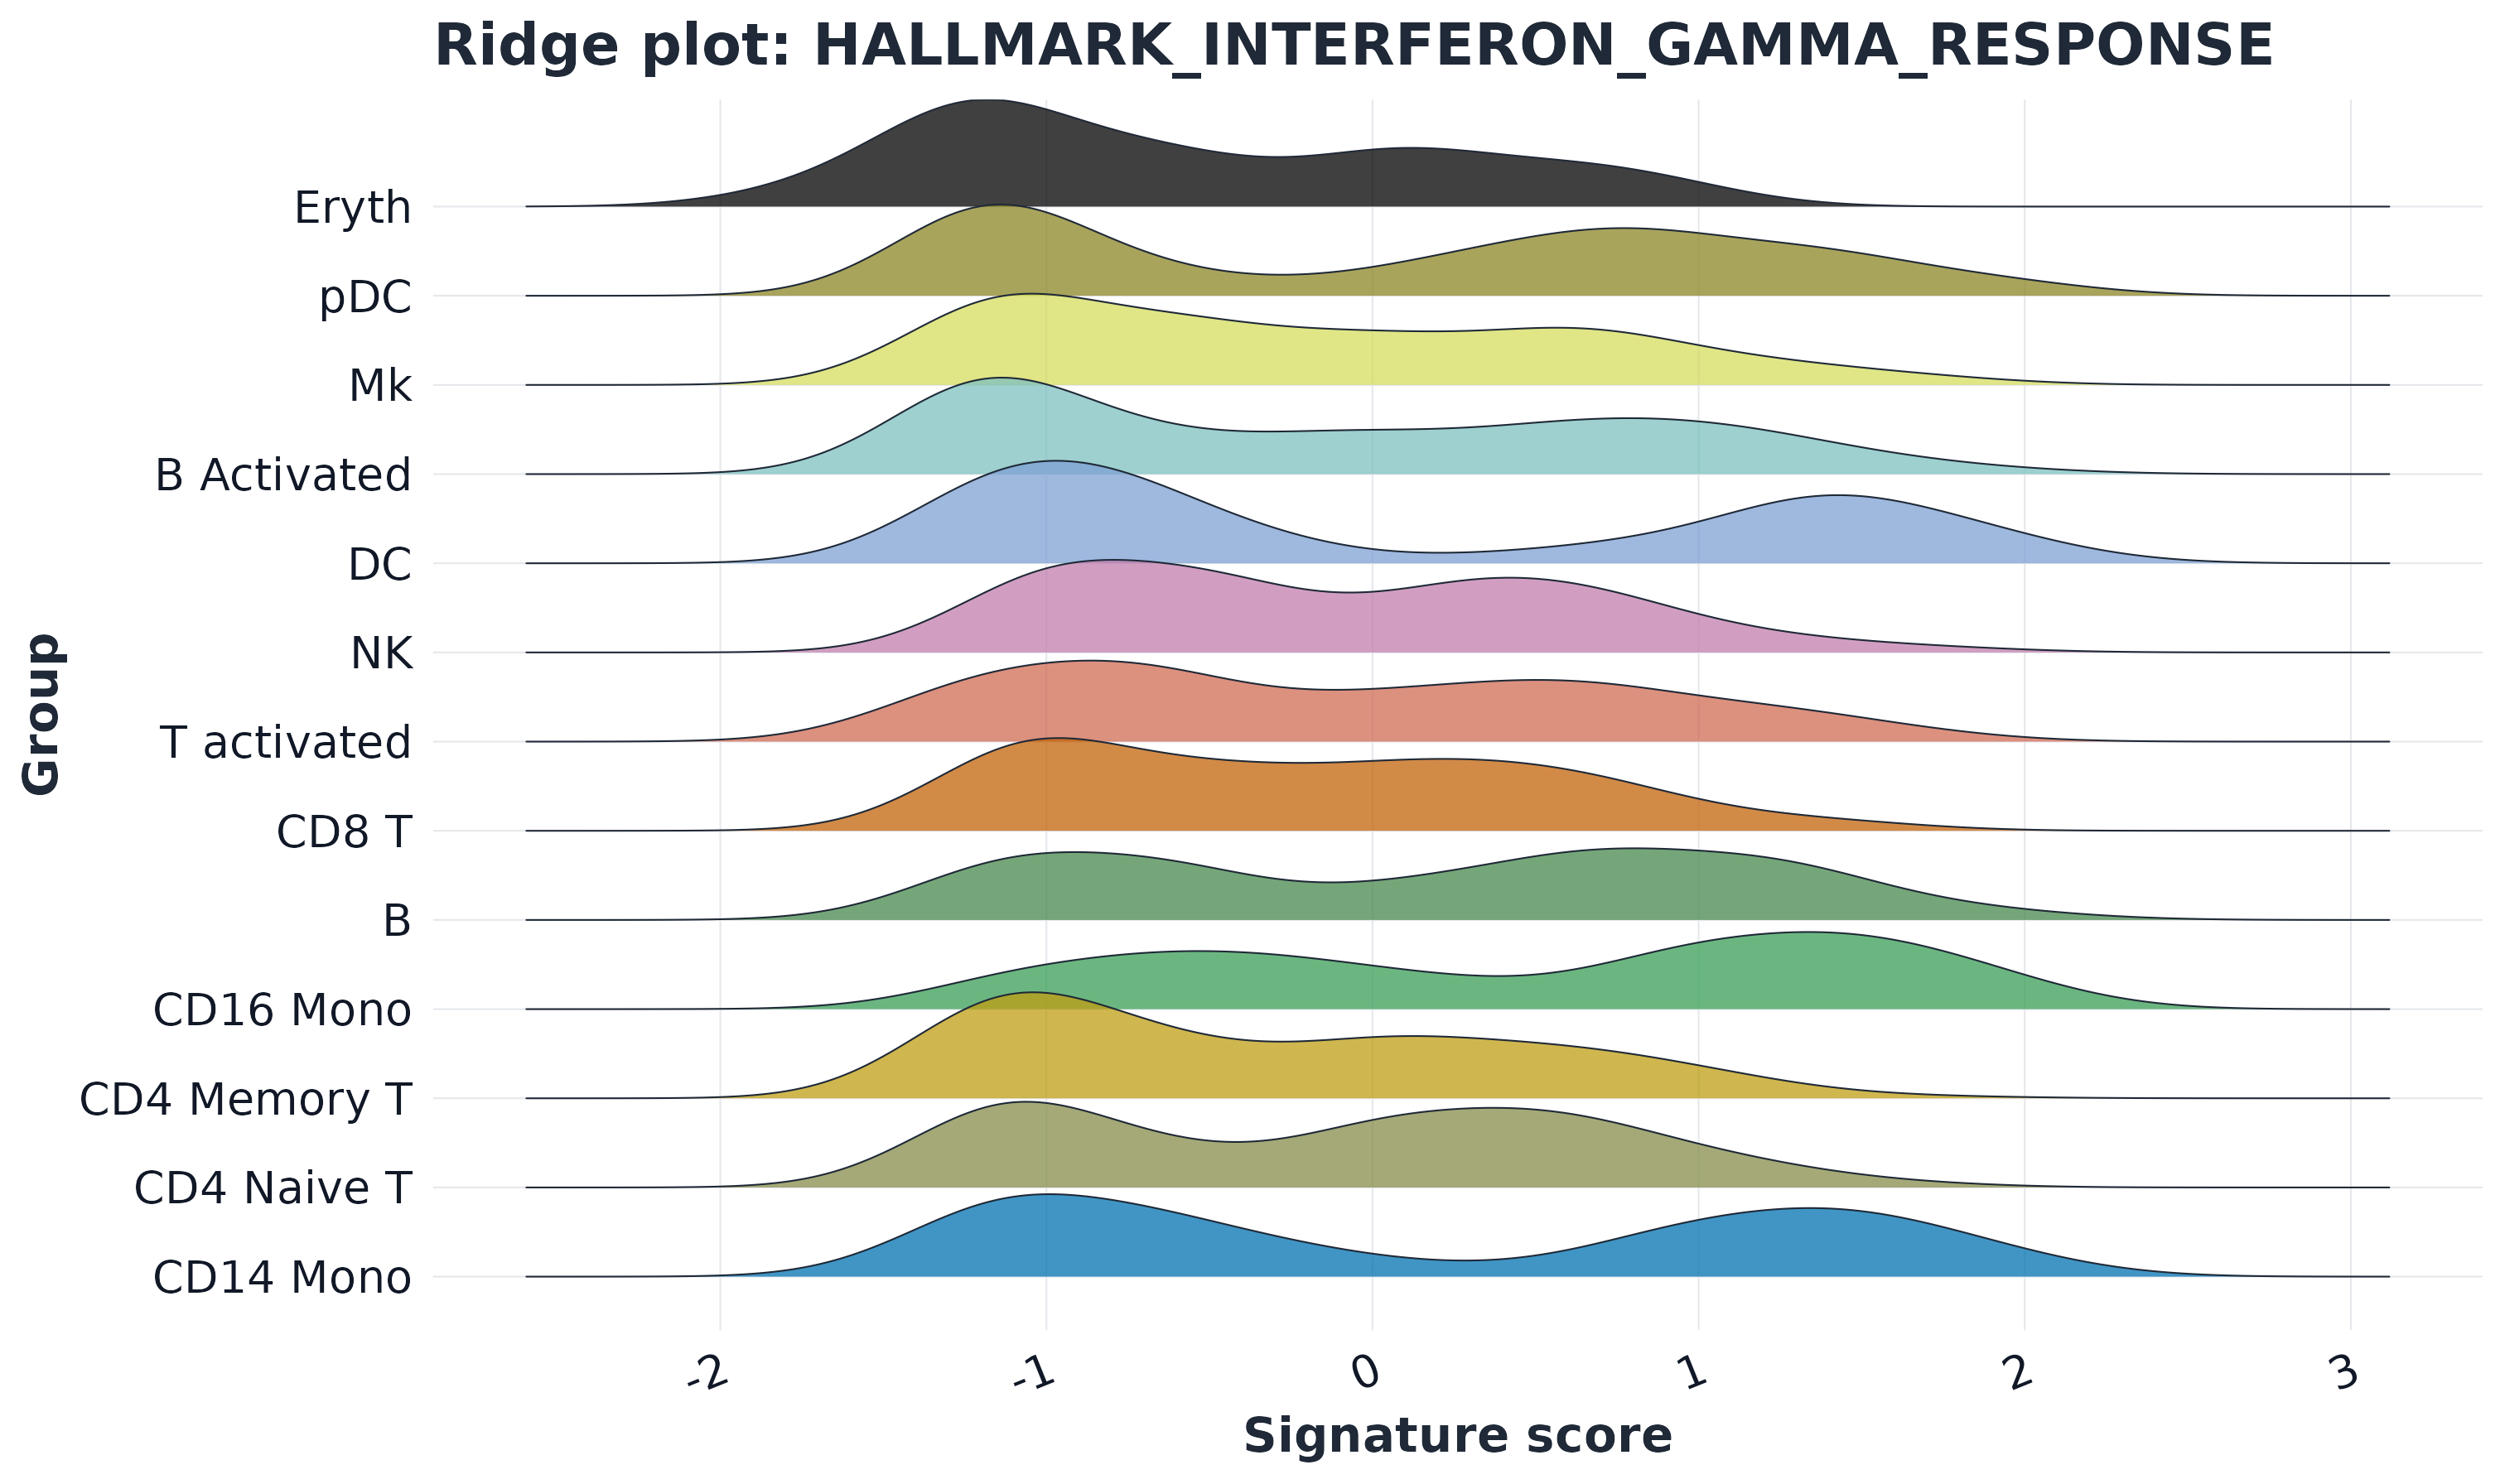
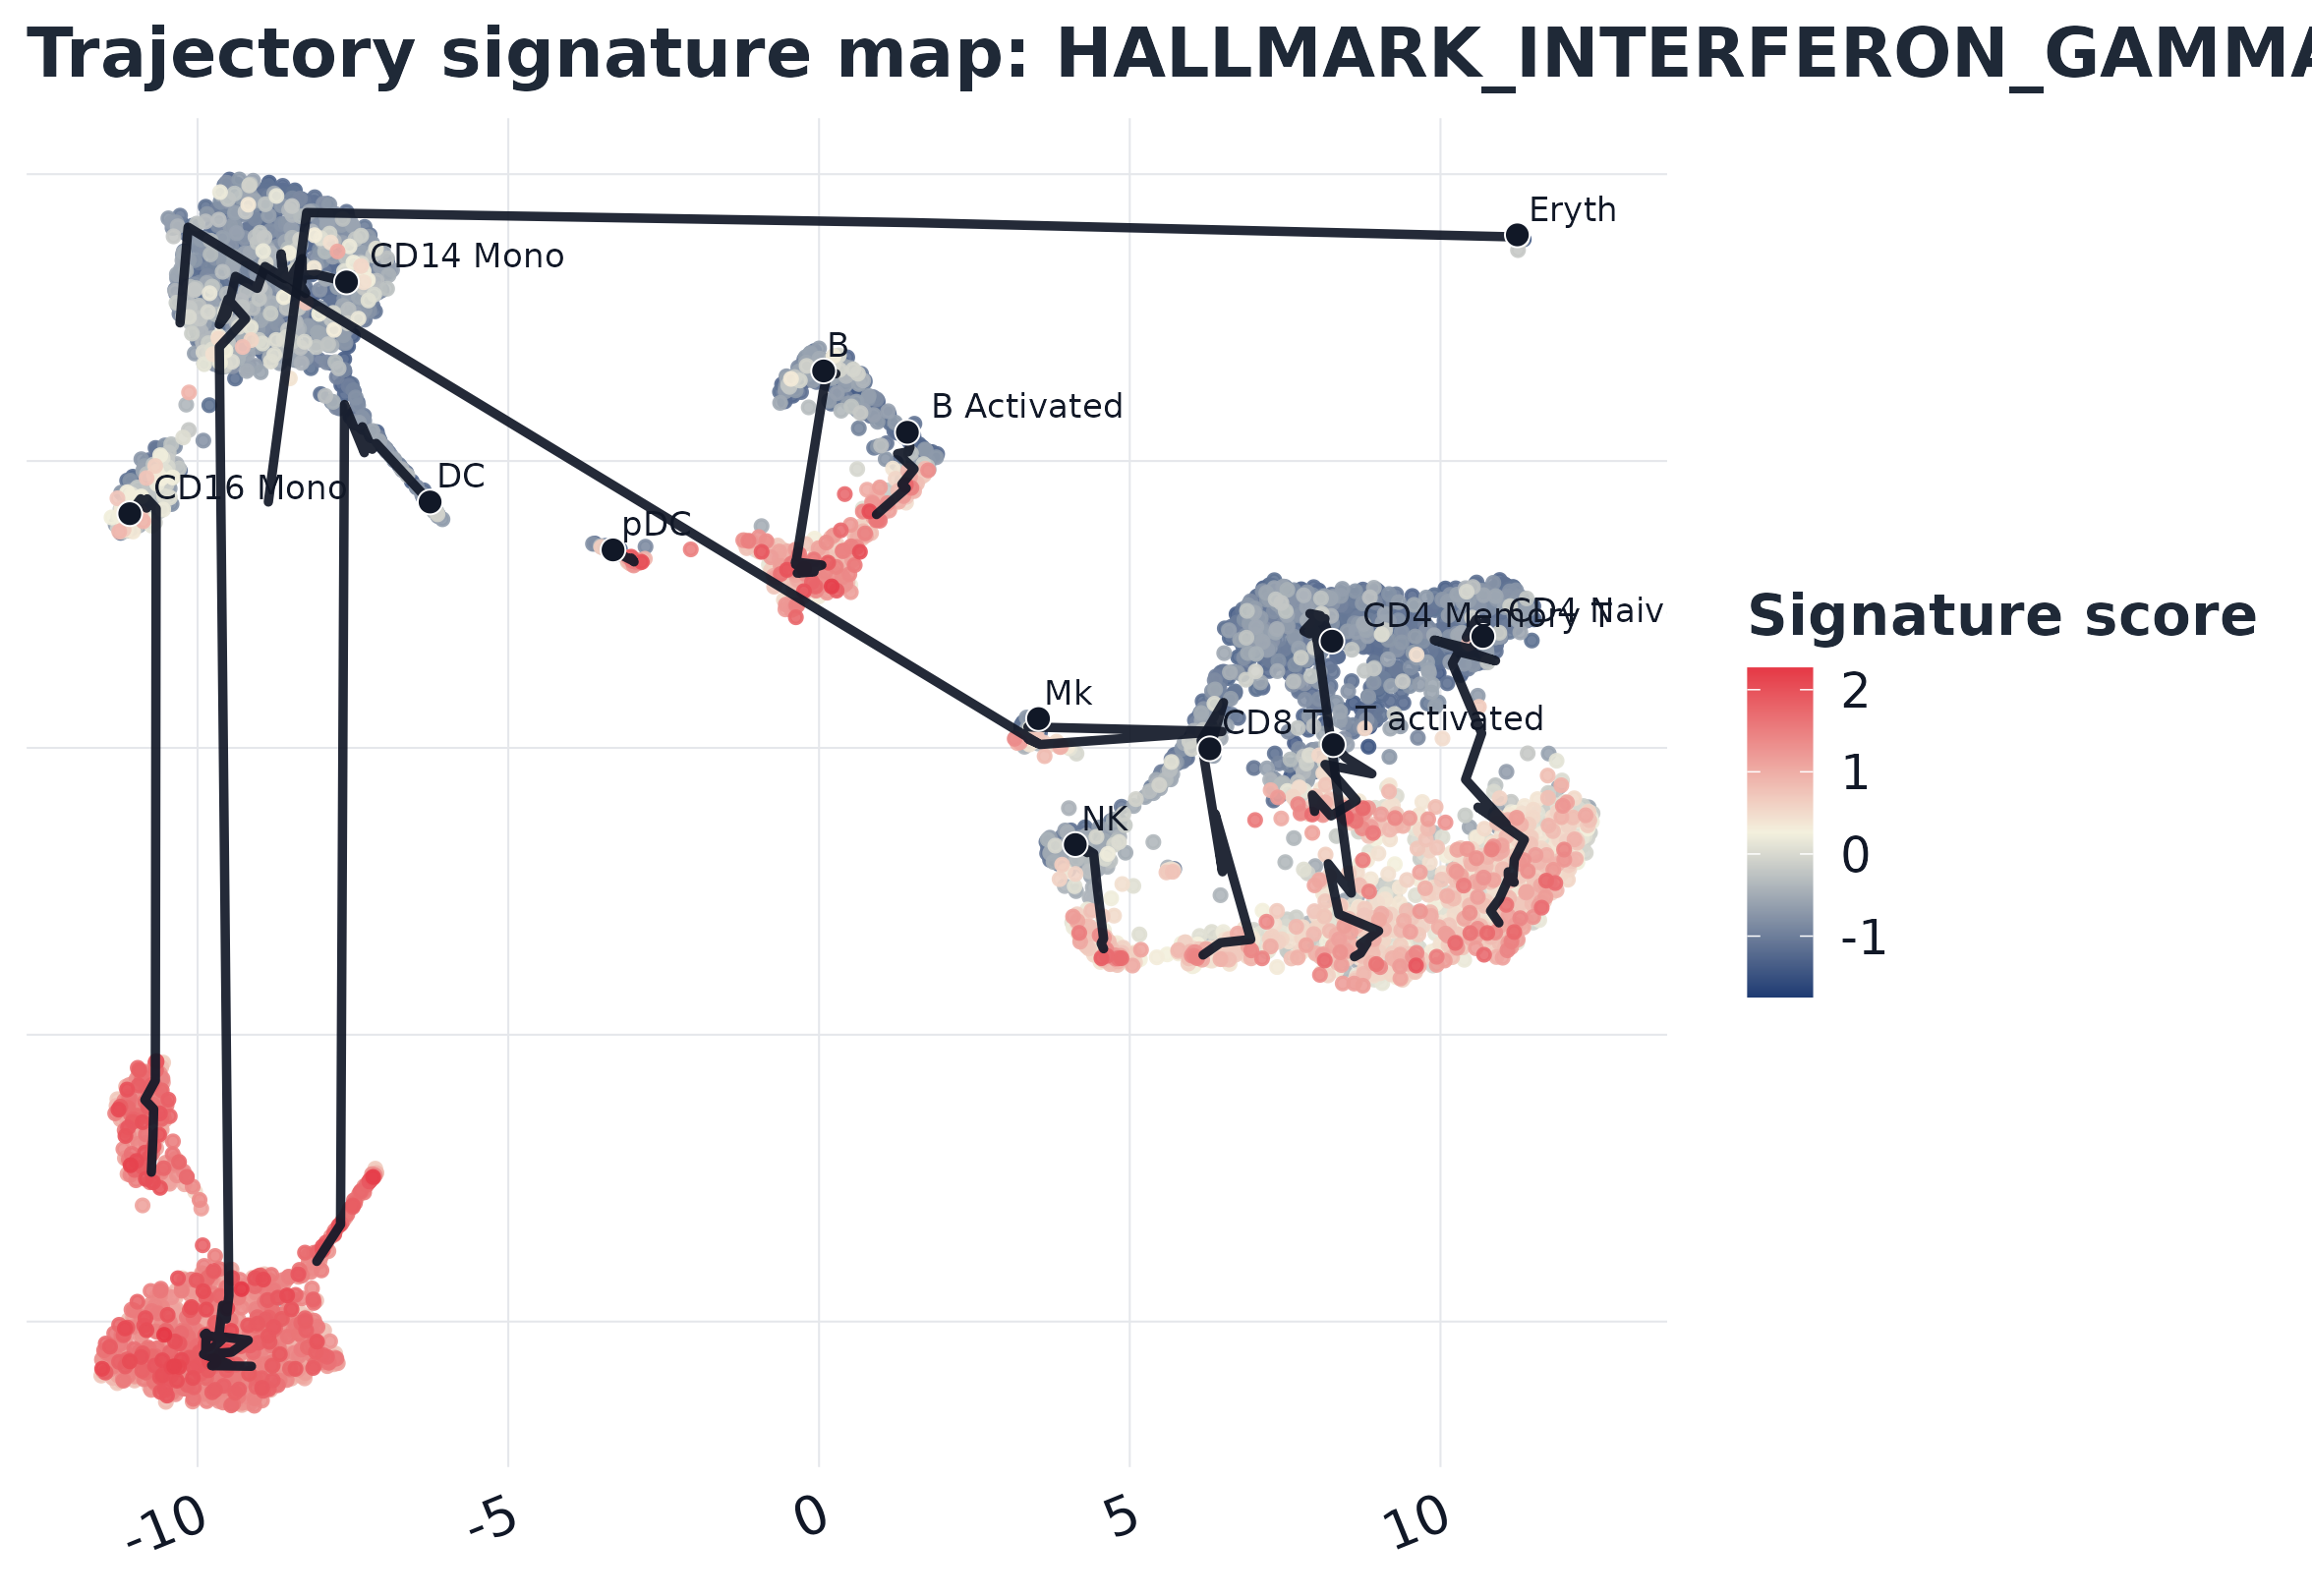
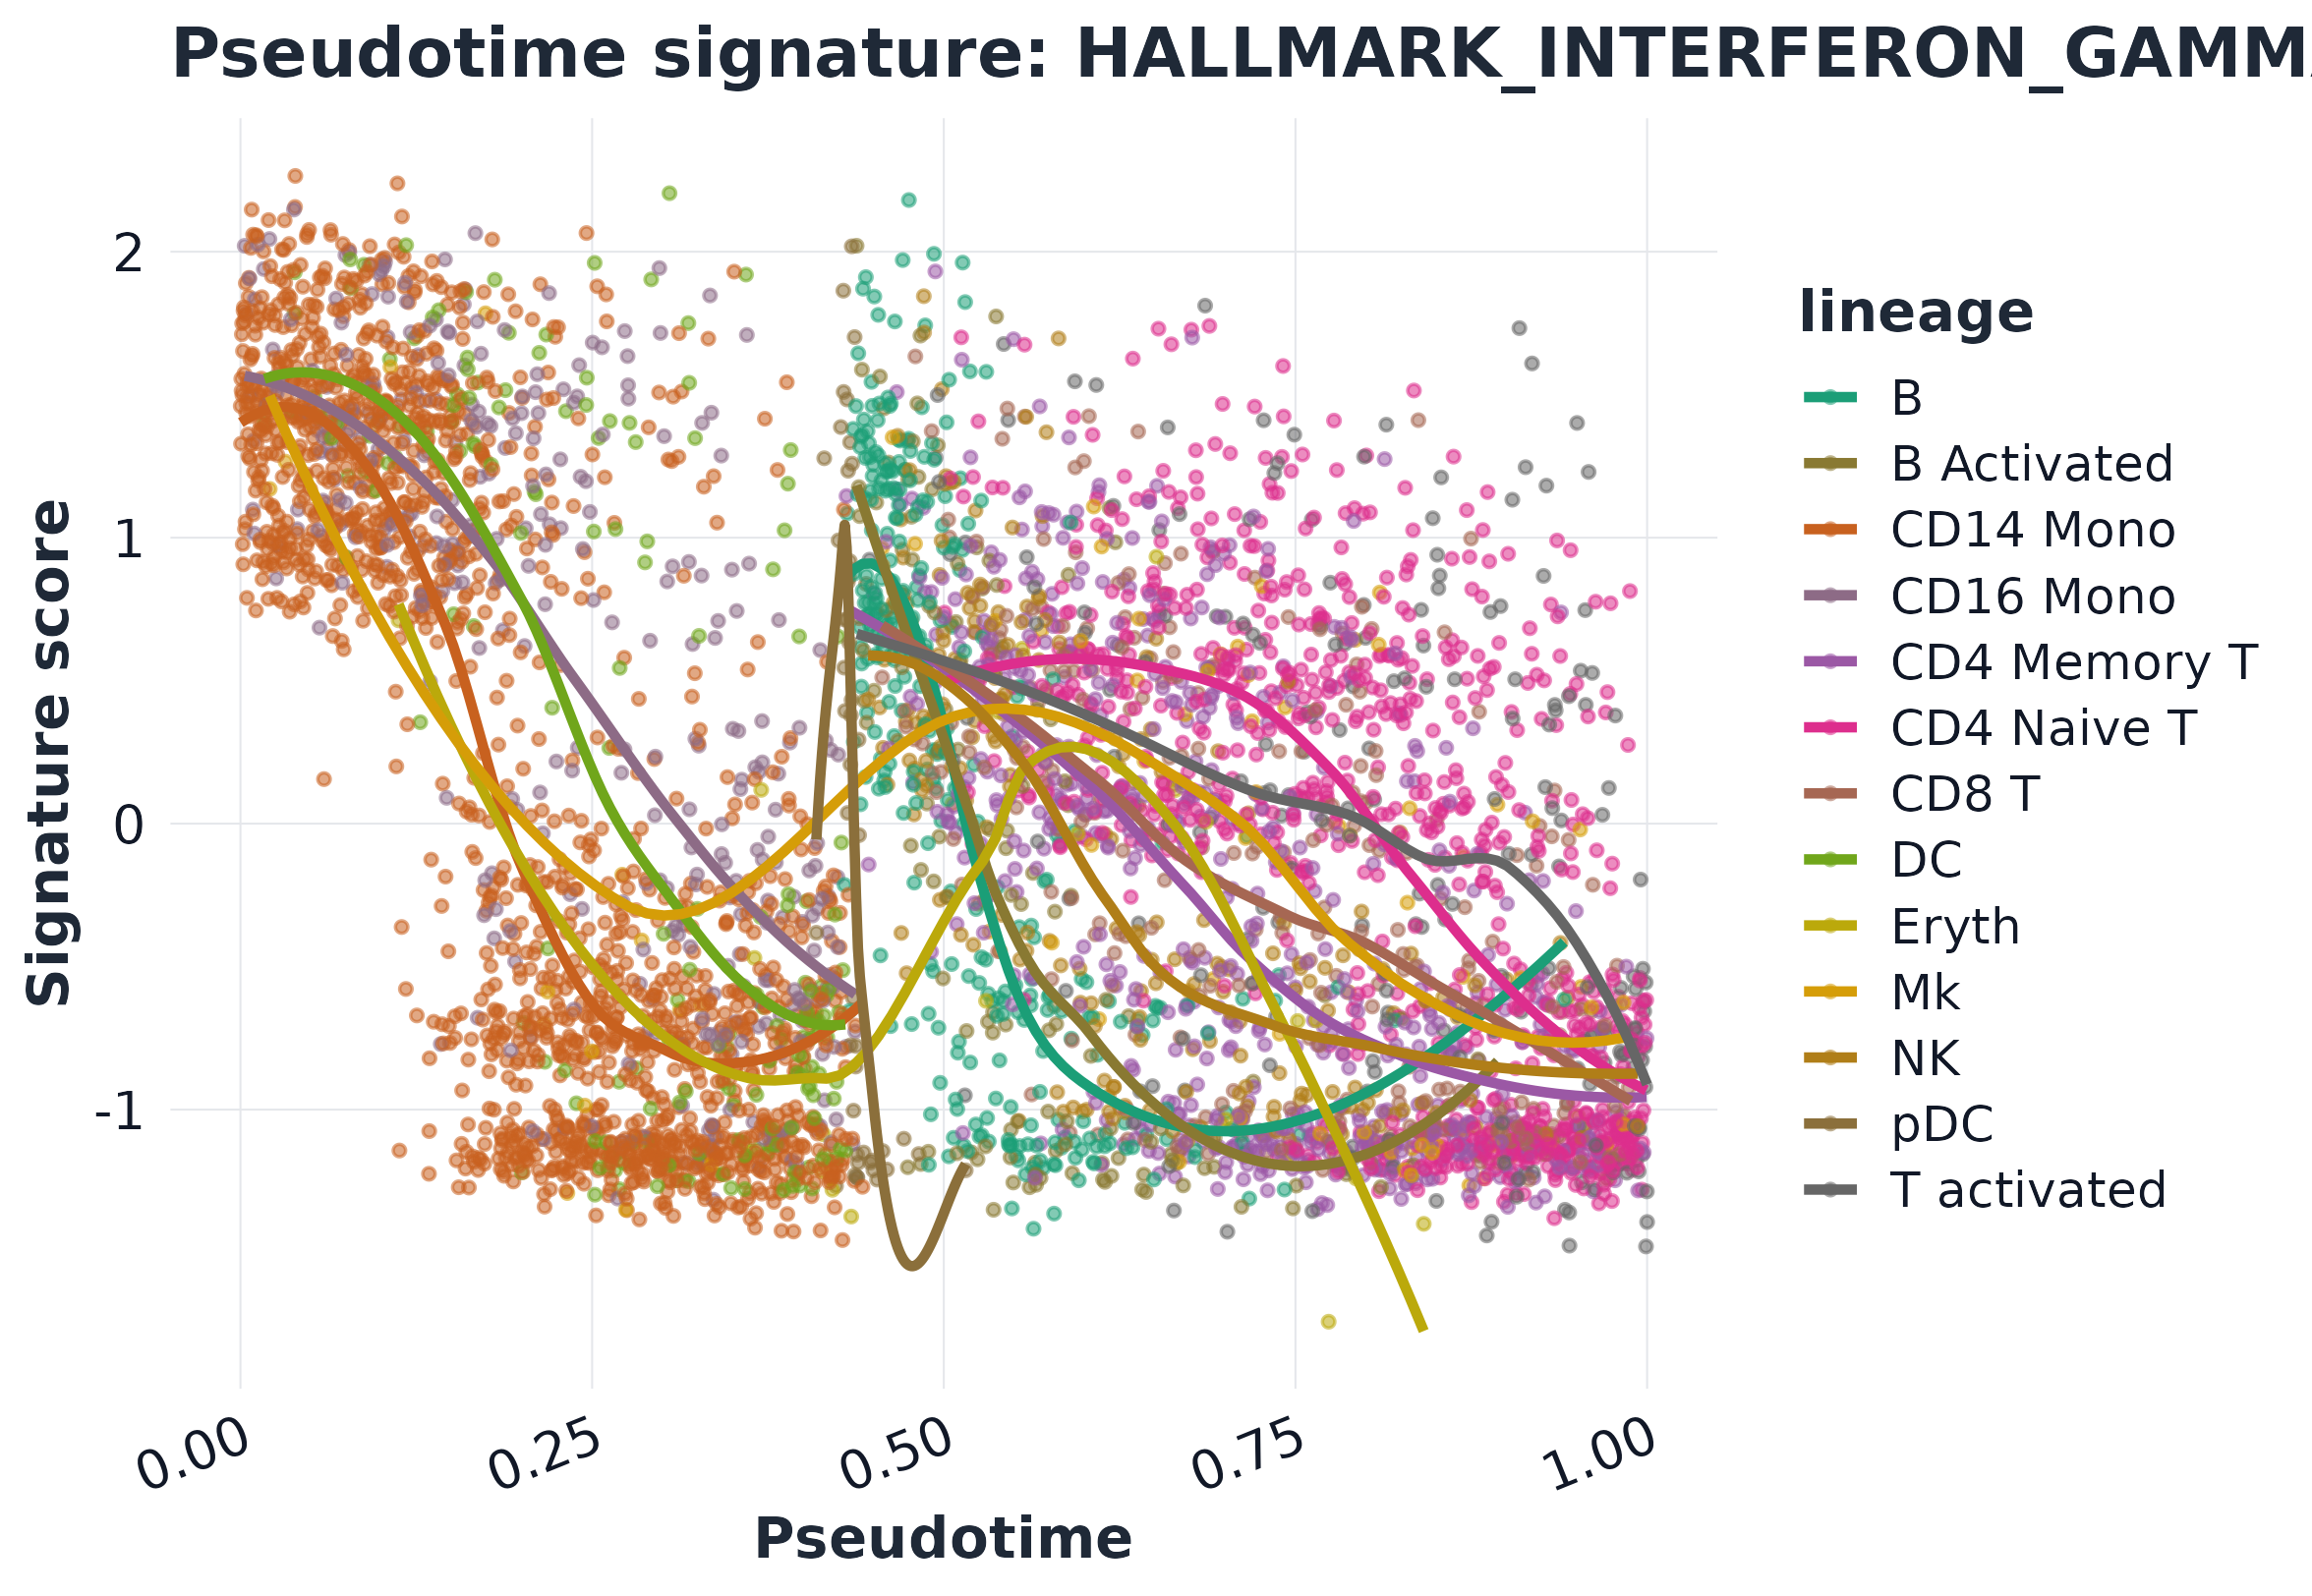
13) Trajectory-style plots
seu$pseudotime <- rank(Embeddings(seu, "pca")[, 1], ties.method = "average") / ncol(seu)
seu$lineage <- as.character(seu$celltype)

sc2 <- score_signature(
  object = seu,
  geneset = gs,
  geneset_source = "list",
  seurat = TRUE,
  assay = "RNA",
  layer = "data",
  slot = "data",
  method = "ensemble",
  min_genes = 3,
  verbose = FALSE
)

lineage_levels <- unique(as.character(sc2$meta$lineage))
pal_lineage <- setNames(get_palette("brewer_dark2", n = length(lineage_levels), continuous = FALSE), lineage_levels)
plot_pseudotime_score(
  sc2,
  signature = top_sig,
  pseudotime = "pseudotime",
  lineage = "lineage",
  palette = pal_lineage
)
plot_trajectory_score(
  sc2,
  signature = top_sig,
  object = seu,
  reduction = "umap",
  palette = "gleam_continuous"
)